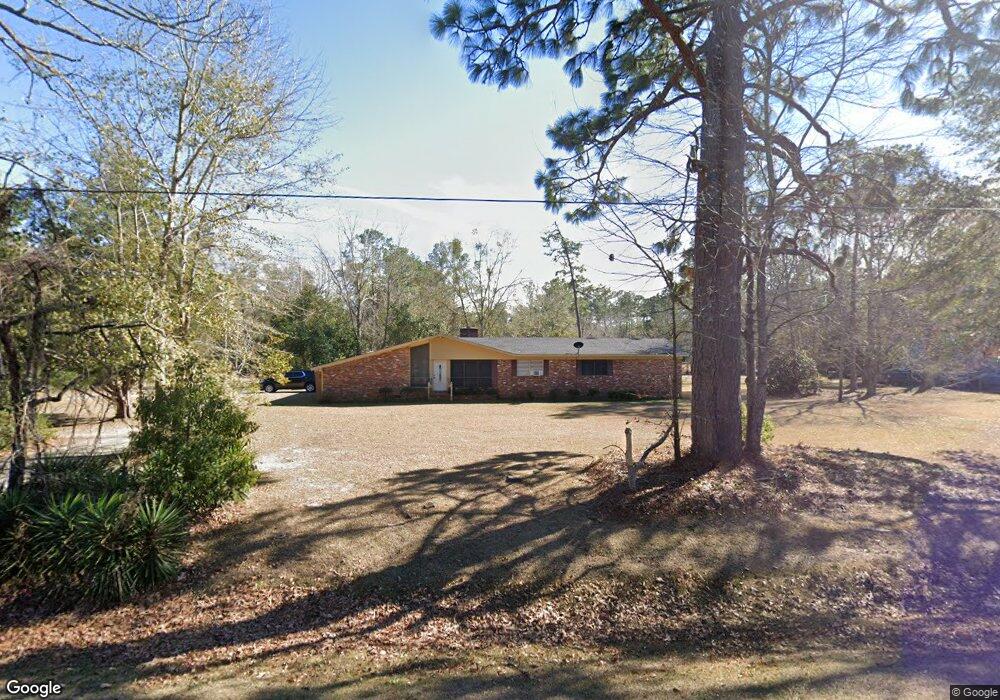
790 Dillon Rd Thomasville, GA 31757
Estimated Value: $237,000 - $308,000
--
Bed
3
Baths
2,870
Sq Ft
$95/Sq Ft
Est. Value
About This Home
This home is located at 790 Dillon Rd, Thomasville, GA 31757 and is currently estimated at $273,507, approximately $95 per square foot. 790 Dillon Rd is a home located in Thomas County with nearby schools including Hand in Hand Primary School, Cross Creek Elementary School, and Garrison-Pilcher Elementary School.
Ownership History
Date
Name
Owned For
Owner Type
Purchase Details
Closed on
May 8, 2024
Sold by
Tinsley Anita Prince
Bought by
Mcnichols Brian L
Current Estimated Value
Home Financials for this Owner
Home Financials are based on the most recent Mortgage that was taken out on this home.
Original Mortgage
$185,000
Outstanding Balance
$174,564
Interest Rate
6.16%
Mortgage Type
New Conventional
Estimated Equity
$98,943
Purchase Details
Closed on
Apr 30, 2008
Sold by
Anita Tinsl P
Bought by
Wilcox Tony Lee
Purchase Details
Closed on
Oct 23, 2007
Sold by
Mckenzie Wyman
Bought by
Wilcox Tony Lee
Purchase Details
Closed on
Oct 19, 2007
Sold by
Tinsley Prince Sandra Anit
Bought by
Mckenzie Wyman and Mckenzie Tawanna
Purchase Details
Closed on
May 18, 2006
Sold by
Tinsley John W
Bought by
Tinsley Anita P
Purchase Details
Closed on
Nov 10, 2005
Sold by
Tinsley John W
Bought by
Tinsley Anita P
Create a Home Valuation Report for This Property
The Home Valuation Report is an in-depth analysis detailing your home's value as well as a comparison with similar homes in the area
Home Values in the Area
Average Home Value in this Area
Purchase History
| Date | Buyer | Sale Price | Title Company |
|---|---|---|---|
| Mcnichols Brian L | $225,000 | -- | |
| Wilcox Tony Lee | $4,500 | -- | |
| Wilcox Tony Lee | $185,000 | -- | |
| Mckenzie Wyman | -- | -- | |
| Tinsley Prince Sandra Anita | -- | -- | |
| Tinsley Anita P | -- | -- | |
| Pohlman Michael E | $36,000 | -- | |
| Tinsley Anita P | -- | -- | |
| Stephens Shayne P | $34,000 | -- |
Source: Public Records
Mortgage History
| Date | Status | Borrower | Loan Amount |
|---|---|---|---|
| Open | Mcnichols Brian L | $185,000 |
Source: Public Records
Tax History Compared to Growth
Tax History
| Year | Tax Paid | Tax Assessment Tax Assessment Total Assessment is a certain percentage of the fair market value that is determined by local assessors to be the total taxable value of land and additions on the property. | Land | Improvement |
|---|---|---|---|---|
| 2024 | $2,195 | $105,083 | $16,250 | $88,833 |
| 2023 | $1,948 | $95,303 | $12,999 | $82,304 |
| 2022 | $1,908 | $84,081 | $12,999 | $71,082 |
| 2021 | $1,762 | $70,184 | $11,304 | $58,880 |
| 2020 | $1,766 | $68,456 | $11,304 | $57,152 |
| 2019 | $1,786 | $68,456 | $11,304 | $57,152 |
| 2018 | $1,770 | $66,428 | $11,304 | $55,124 |
| 2017 | $1,800 | $66,448 | $11,304 | $55,144 |
| 2016 | $1,784 | $65,296 | $11,304 | $53,992 |
| 2015 | $1,792 | $64,499 | $11,304 | $53,195 |
| 2014 | $1,767 | $63,246 | $11,304 | $51,942 |
| 2013 | -- | $64,880 | $11,304 | $53,576 |
Source: Public Records
Map
Nearby Homes
- 148 Cypress Ln
- 13310 N Us Hwy 319
- 220 Dillon Rd
- 0000 Sanford Road (47 83 Acres)
- 220 Dillon Rd (28 Acres)
- 12112 Us Highway 319 N
- 221 Ginger Ln
- 113 Lost Creek Ln
- 125 Lost Creek Ln
- 1327 Hall Rd
- 109 Jordan Dr
- 108 Kelon Dr
- 120 Kelon Dr
- 115 Jordan Dr
- 102 Palm Island Dr
- 104 Palm Island Dr
- 108 Palm Island Dr
- 110 Palm Island Dr
- 4131 Ga Hwy 122
- 107 Andee Way