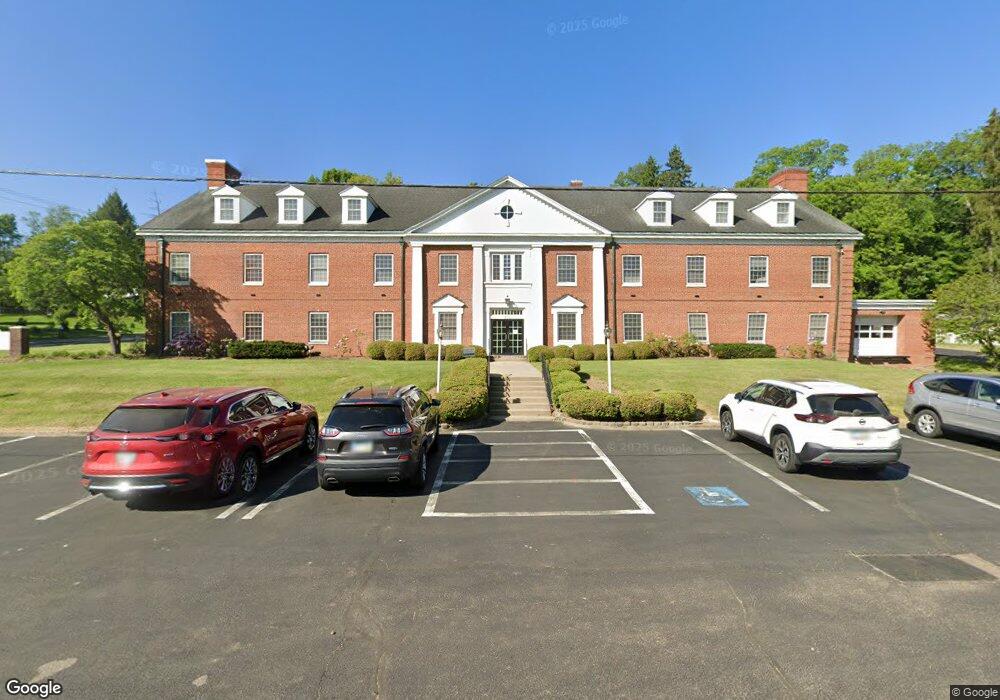
790 Fairgrounds Rd Mount Vernon, OH 43050
Estimated Value: $796,896
Studio
1
Bath
16,125
Sq Ft
$49/Sq Ft
Est. Value
About This Home
This home is located at 790 Fairgrounds Rd, Mount Vernon, OH 43050 and is currently estimated at $796,896, approximately $49 per square foot. 790 Fairgrounds Rd is a home located in Knox County with nearby schools including Mount Vernon High School and Mount Vernon Sda Elementary School.
Ownership History
Date
Name
Owned For
Owner Type
Purchase Details
Closed on
Jun 21, 2022
Sold by
Minder Darren D
Bought by
Beverlyand Christina I and Beverlyand Beverly Joshua
Current Estimated Value
Home Financials for this Owner
Home Financials are based on the most recent Mortgage that was taken out on this home.
Original Mortgage
$230,743
Outstanding Balance
$220,493
Interest Rate
5.78%
Estimated Equity
$576,403
Purchase Details
Closed on
Jul 31, 2019
Sold by
Ohio Conference Of Seventh Day Adv Church
Bought by
Knox County Properties Llc
Home Financials for this Owner
Home Financials are based on the most recent Mortgage that was taken out on this home.
Interest Rate
3.75%
Purchase Details
Closed on
Jan 1, 1987
Bought by
Ohio Conference Of Seventh Day Adv Churc
Create a Home Valuation Report for This Property
The Home Valuation Report is an in-depth analysis detailing your home's value as well as a comparison with similar homes in the area
Home Values in the Area
Average Home Value in this Area
Purchase History
| Date | Buyer | Sale Price | Title Company |
|---|---|---|---|
| Beverlyand Christina I | -- | None Listed On Document | |
| Knox County Properties Llc | $450,000 | -- | |
| Ohio Conference Of Seventh Day Adv Churc | -- | -- |
Source: Public Records
Mortgage History
| Date | Status | Borrower | Loan Amount |
|---|---|---|---|
| Open | Beverlyand Christina I | $230,743 | |
| Previous Owner | Knox County Properties Llc | -- |
Source: Public Records
Tax History
| Year | Tax Paid | Tax Assessment Tax Assessment Total Assessment is a certain percentage of the fair market value that is determined by local assessors to be the total taxable value of land and additions on the property. | Land | Improvement |
|---|---|---|---|---|
| 2024 | $7,039 | $134,750 | $10,010 | $124,740 |
| 2023 | $7,137 | $134,750 | $10,010 | $124,740 |
| 2022 | $6,998 | $122,500 | $9,100 | $113,400 |
| 2021 | $6,998 | $122,500 | $9,100 | $113,400 |
| 2020 | $6,768 | $122,500 | $9,100 | $113,400 |
| 2019 | $30 | $266,510 | $9,100 | $257,410 |
| 2018 | $30 | $266,510 | $9,100 | $257,410 |
| 2017 | $30 | $266,510 | $9,100 | $257,410 |
| 2016 | $30 | $266,510 | $9,100 | $257,410 |
| 2015 | $30 | $266,510 | $9,100 | $257,410 |
| 2014 | $30 | $266,510 | $9,100 | $257,410 |
| 2013 | $60 | $245,560 | $6,130 | $239,430 |
Source: Public Records
Map
Nearby Homes
- 19 Avalon Rd
- 332 Wooster Rd
- 0 Miami St
- 6 Fairway Dr
- 612 N Clinton St
- 13 Eastgate Dr
- 1737 Vernonview Dr
- 1309 N Mulberry St
- 419 E Pleasant St
- 1 Hilltop Dr
- 418 E Pleasant St
- 26-30 Dogwood Terrace
- 608 N Gay St
- 23 Upland Terrace
- 107 E Lamartine St
- 28 Upland Terrace
- 208 E Burgess St
- 200 Eastwood Dr
- 213 Coshocton Ave
- 607 N Mulberry St
- 770 Fairgrounds Rd
- 8 Fairgrounds Rd
- 463 Wooster Rd
- 760 Fairgrounds Rd
- 12 Fairgrounds Rd
- 6 Fairgrounds Rd
- 780 Fairgrounds Rd
- 418 Sychar Rd
- 461 Wooster Rd
- 750 Fairgrounds Rd
- 14 Fairgrounds Rd
- 504 Wooster Rd
- 1 Grandview Dr
- 740 Fairgrounds Rd
- 414 Sychar Rd
- 506 Wooster Rd
- 3 Grandview Dr
- 455 Wooster Rd
- 5 Grandview Dr
- 7 Grandview Dr
Your Personal Tour Guide
Ask me questions while you tour the home.