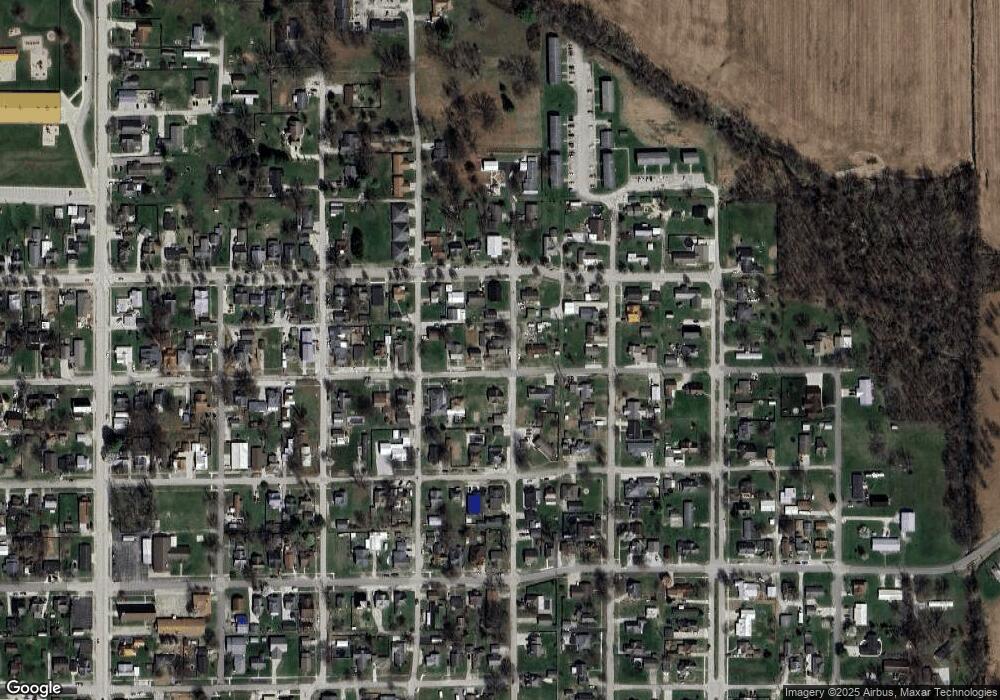
790 G St NE Linton, IN 47441
Estimated Value: $197,650 - $259,000
3
Beds
2
Baths
3,230
Sq Ft
$71/Sq Ft
Est. Value
About This Home
This home is located at 790 G St NE, Linton, IN 47441 and is currently estimated at $228,913, approximately $70 per square foot. 790 G St NE is a home located in Greene County with nearby schools including Linton-Stockton Elementary School, Linton-Stockton Junior High School, and Linton-Stockton High School.
Ownership History
Date
Name
Owned For
Owner Type
Purchase Details
Closed on
May 8, 2017
Sold by
Moore Debra A and Moore Bruce A
Bought by
Moore Christopher B and Moore Jaclyn
Current Estimated Value
Home Financials for this Owner
Home Financials are based on the most recent Mortgage that was taken out on this home.
Original Mortgage
$86,000
Interest Rate
4.1%
Mortgage Type
New Conventional
Purchase Details
Closed on
Jun 26, 2008
Sold by
Moore Homer L
Bought by
Moore Debra A and Moore Burce A
Create a Home Valuation Report for This Property
The Home Valuation Report is an in-depth analysis detailing your home's value as well as a comparison with similar homes in the area
Home Values in the Area
Average Home Value in this Area
Purchase History
| Date | Buyer | Sale Price | Title Company |
|---|---|---|---|
| Moore Christopher B | -- | -- | |
| Moore Debra A | -- | None Available |
Source: Public Records
Mortgage History
| Date | Status | Borrower | Loan Amount |
|---|---|---|---|
| Closed | Moore Christopher B | $86,000 |
Source: Public Records
Tax History Compared to Growth
Tax History
| Year | Tax Paid | Tax Assessment Tax Assessment Total Assessment is a certain percentage of the fair market value that is determined by local assessors to be the total taxable value of land and additions on the property. | Land | Improvement |
|---|---|---|---|---|
| 2024 | $831 | $81,900 | $6,900 | $75,000 |
| 2023 | $813 | $81,100 | $6,900 | $74,200 |
| 2022 | $830 | $83,500 | $6,900 | $76,600 |
| 2021 | $741 | $76,800 | $6,900 | $69,900 |
| 2020 | $635 | $73,500 | $6,900 | $66,600 |
| 2019 | $673 | $73,500 | $6,900 | $66,600 |
| 2018 | $729 | $77,700 | $6,900 | $70,800 |
| 2017 | $873 | $85,100 | $6,900 | $78,200 |
| 2016 | $910 | $87,600 | $6,900 | $80,700 |
| 2014 | $768 | $80,400 | $6,900 | $73,500 |
| 2013 | -- | $79,600 | $6,900 | $72,700 |
Source: Public Records
Map
Nearby Homes