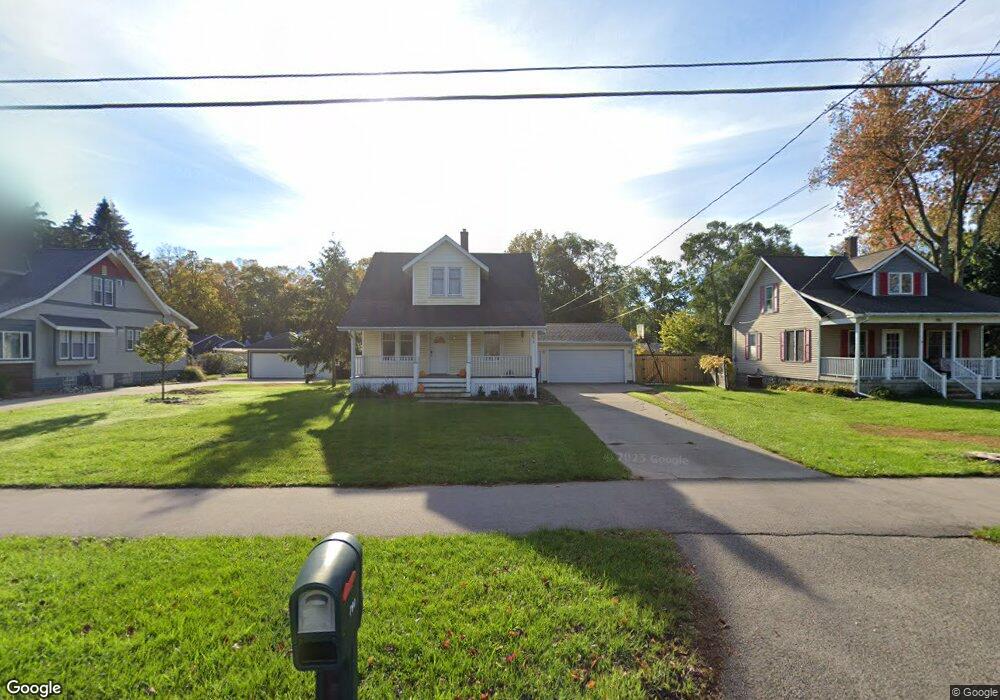
790 Paw Paw Dr Holland, MI 49423
Holland Heights NeighborhoodEstimated Value: $331,584 - $353,000
4
Beds
4
Baths
1,555
Sq Ft
$218/Sq Ft
Est. Value
About This Home
This home is located at 790 Paw Paw Dr, Holland, MI 49423 and is currently estimated at $338,396, approximately $217 per square foot. 790 Paw Paw Dr is a home located in Ottawa County with nearby schools including Holland Heights Elementary, Maplewood, and Holland High School.
Ownership History
Date
Name
Owned For
Owner Type
Purchase Details
Closed on
Jul 13, 2022
Sold by
Adkins Blake S and Adkins Sarah F
Bought by
Sprik Jessica and Sprik Josh
Current Estimated Value
Home Financials for this Owner
Home Financials are based on the most recent Mortgage that was taken out on this home.
Original Mortgage
$274,928
Outstanding Balance
$261,563
Interest Rate
5.09%
Mortgage Type
FHA
Estimated Equity
$76,833
Purchase Details
Closed on
Mar 15, 2010
Sold by
Steenwyk Eric J and Steenwyk Lee Anne
Bought by
Adkins Blake S and Adkins Sarah F
Home Financials for this Owner
Home Financials are based on the most recent Mortgage that was taken out on this home.
Original Mortgage
$115,862
Interest Rate
5.01%
Mortgage Type
FHA
Purchase Details
Closed on
Jan 25, 2000
Sold by
Elushik Richard D
Bought by
Steenwyk Eric J
Purchase Details
Closed on
Sep 9, 1985
Sold by
Elushik Richard D
Create a Home Valuation Report for This Property
The Home Valuation Report is an in-depth analysis detailing your home's value as well as a comparison with similar homes in the area
Home Values in the Area
Average Home Value in this Area
Purchase History
| Date | Buyer | Sale Price | Title Company |
|---|---|---|---|
| Sprik Jessica | $280,000 | Lighthouse Title | |
| Adkins Blake S | $118,000 | Lighthouse Title Inc | |
| Steenwyk Eric J | $118,300 | -- | |
| -- | $51,000 | -- |
Source: Public Records
Mortgage History
| Date | Status | Borrower | Loan Amount |
|---|---|---|---|
| Open | Sprik Jessica | $274,928 | |
| Previous Owner | Adkins Blake S | $115,862 |
Source: Public Records
Tax History Compared to Growth
Tax History
| Year | Tax Paid | Tax Assessment Tax Assessment Total Assessment is a certain percentage of the fair market value that is determined by local assessors to be the total taxable value of land and additions on the property. | Land | Improvement |
|---|---|---|---|---|
| 2025 | $4,270 | $125,400 | $0 | $0 |
| 2024 | $4,119 | $116,200 | $0 | $0 |
| 2023 | $7,665 | $95,800 | $0 | $0 |
| 2022 | $2,446 | $93,300 | $0 | $0 |
| 2021 | $2,378 | $90,800 | $0 | $0 |
| 2020 | $2,374 | $81,100 | $0 | $0 |
| 2019 | $2,393 | $72,200 | $0 | $0 |
| 2018 | $2,253 | $61,500 | $0 | $0 |
| 2017 | $2,183 | $61,500 | $0 | $0 |
| 2016 | $2,183 | $61,900 | $0 | $0 |
| 2015 | $2,115 | $57,500 | $0 | $0 |
| 2014 | $2,115 | $55,400 | $0 | $0 |
Source: Public Records
Map
Nearby Homes
- 239 S Waverly Rd
- VL-0 120th Ave
- 499 E 8th St
- 1078 Lynden Rd
- 1101 Lynden Rd
- 403 Stratford Way
- VL 120th Ave
- 1214 Euna Vista Dr
- 160 Sorrento Dr
- 551 Century Ln
- 541 Century Ln
- 561 Century Ln
- 866 E 24th St Unit Parcel A
- 271 E 16th St
- 1391 Quarterline Commons
- 955 Kenwood Dr
- 442 120th Ave
- 451 Lincoln Ave
- 634 Wilshire Ct
- 333 E Lakewood Blvd Unit 209