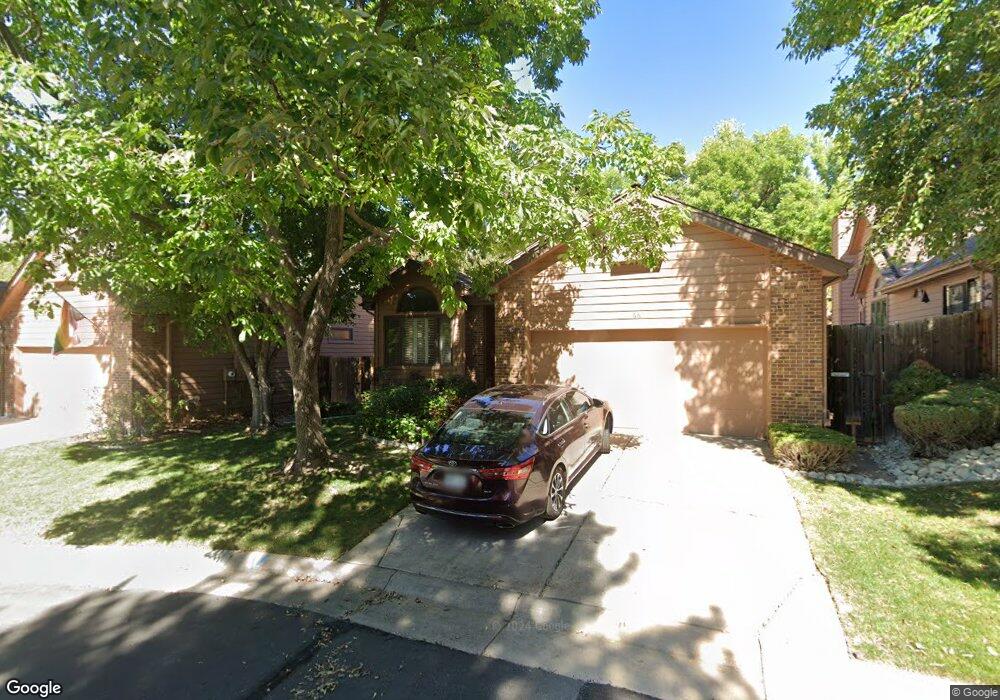
7900 E Dartmouth Ave Denver, CO 80231
Hampden NeighborhoodEstimated Value: $649,427 - $724,000
2
Beds
3
Baths
1,374
Sq Ft
$492/Sq Ft
Est. Value
About This Home
This home is located at 7900 E Dartmouth Ave, Denver, CO 80231 and is currently estimated at $676,357, approximately $492 per square foot. 7900 E Dartmouth Ave is a home located in Denver County with nearby schools including Holm Elementary School, Samuels Elementary School, and Joe Shoemaker School.
Ownership History
Date
Name
Owned For
Owner Type
Purchase Details
Closed on
Mar 31, 2016
Sold by
The Carl G & Celeste M Oberle Family Byp
Bought by
Swanson Jenilee
Current Estimated Value
Home Financials for this Owner
Home Financials are based on the most recent Mortgage that was taken out on this home.
Original Mortgage
$326,000
Outstanding Balance
$258,647
Interest Rate
3.64%
Mortgage Type
New Conventional
Estimated Equity
$417,710
Purchase Details
Closed on
Mar 27, 2001
Sold by
Oberle Carl G
Bought by
The Carl G & Celeste M Oberle Trust
Purchase Details
Closed on
Aug 7, 1997
Sold by
Carlson Mary Jane
Bought by
Oberle Carl G and Oberle Celeste M
Home Financials for this Owner
Home Financials are based on the most recent Mortgage that was taken out on this home.
Original Mortgage
$189,500
Interest Rate
9%
Mortgage Type
Seller Take Back
Create a Home Valuation Report for This Property
The Home Valuation Report is an in-depth analysis detailing your home's value as well as a comparison with similar homes in the area
Home Values in the Area
Average Home Value in this Area
Purchase History
| Date | Buyer | Sale Price | Title Company |
|---|---|---|---|
| Swanson Jenilee | $407,500 | None Available | |
| The Carl G & Celeste M Oberle Family Byp | -- | None Available | |
| The Carl G & Celeste M Oberle Trust | -- | None Available | |
| Oberle Carl G | -- | -- | |
| Oberle Carl G | $224,500 | North American Title |
Source: Public Records
Mortgage History
| Date | Status | Borrower | Loan Amount |
|---|---|---|---|
| Open | The Carl G & Celeste M Oberle Family Byp | $326,000 | |
| Closed | Swanson Jenilee | $326,000 | |
| Previous Owner | Oberle Carl G | $189,500 |
Source: Public Records
Tax History Compared to Growth
Tax History
| Year | Tax Paid | Tax Assessment Tax Assessment Total Assessment is a certain percentage of the fair market value that is determined by local assessors to be the total taxable value of land and additions on the property. | Land | Improvement |
|---|---|---|---|---|
| 2024 | $3,095 | $39,080 | $2,860 | $36,220 |
| 2023 | $3,028 | $39,080 | $2,860 | $36,220 |
| 2022 | $2,581 | $32,450 | $6,790 | $25,660 |
| 2021 | $2,492 | $33,390 | $6,990 | $26,400 |
| 2020 | $2,260 | $30,460 | $6,990 | $23,470 |
| 2019 | $2,197 | $30,460 | $6,990 | $23,470 |
| 2018 | $2,238 | $28,930 | $7,030 | $21,900 |
| 2017 | $2,231 | $28,930 | $7,030 | $21,900 |
| 2016 | $2,374 | $29,110 | $5,835 | $23,275 |
| 2015 | $2,274 | $29,110 | $5,835 | $23,275 |
| 2014 | $1,949 | $23,470 | $7,164 | $16,306 |
Source: Public Records
Map
Nearby Homes
- 7900 E Dartmouth Ave Unit 75
- 8080 E Dartmouth Ave Unit 41
- 7500 E Dartmouth Ave Unit 22
- 7500 E Dartmouth Ave Unit 16
- 7395 E Eastman Ave Unit 305M
- 3121 S Tamarac Dr Unit 302H
- 7665 E Eastman Ave Unit 204B
- 7665 E Eastman Ave Unit 110C
- 7665 E Eastman Ave Unit 111A
- 7665 E Eastman Ave Unit 104A
- 3141 S Tamarac Dr Unit 301E
- 3141 S Tamarac Dr Unit 206E
- 3306 S Uinta Ct
- 2931 S Sidney Ct
- 8060 E Girard Ave Unit 520
- 8060 E Girard Ave Unit 614
- 8060 E Girard Ave Unit 410
- 8060 E Girard Ave Unit 217
- 8060 E Girard Ave Unit 514
- 8060 E Girard Ave Unit 504
- 7900 E Dartmouth Ave Unit 73
- 7900 E Dartmouth Ave Unit 78
- 7900 E Dartmouth Ave Unit 58
- 7900 E Dartmouth Ave
- 7900 E Dartmouth Ave
- 7900 E Dartmouth Ave
- 7900 E Dartmouth Ave
- 7900 E Dartmouth Ave
- 7900 E Dartmouth Ave
- 7900 E Dartmouth Ave
- 7900 E Dartmouth Ave
- 7900 E Dartmouth Ave
- 7900 E Dartmouth Ave
- 7900 E Dartmouth Ave
- 7900 E Dartmouth Ave
- 7900 E Dartmouth Ave
- 7900 E Dartmouth Ave
- 7900 E Dartmouth Ave
- 7900 E Dartmouth Ave
- 7900 E Dartmouth Ave