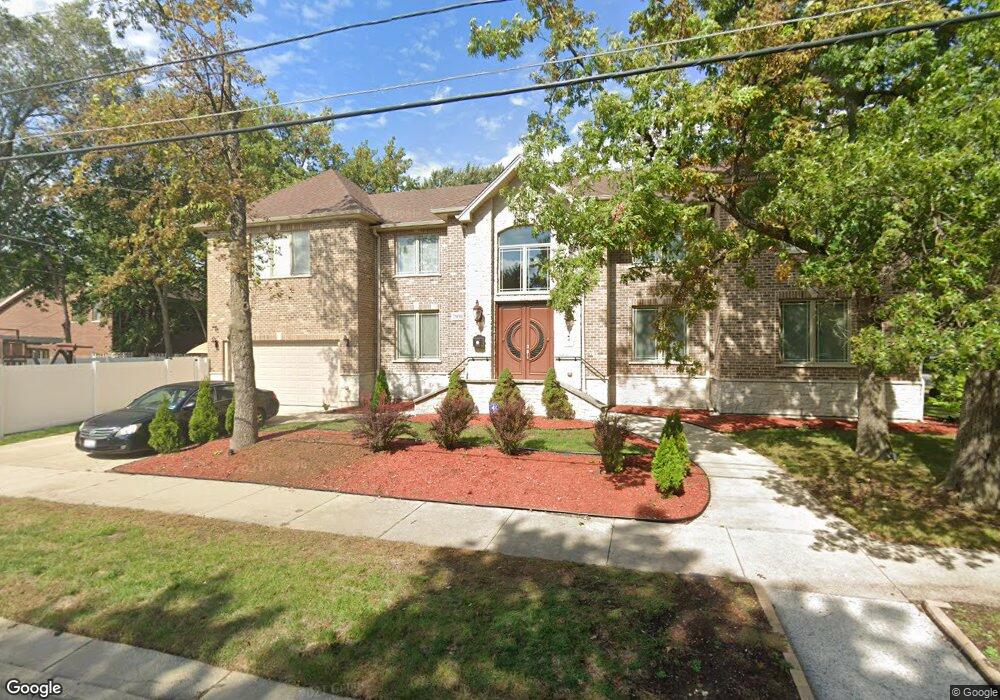
7900 Lotus Ave Morton Grove, IL 60053
Southwest Skokie NeighborhoodEstimated Value: $698,000 - $813,000
5
Beds
5
Baths
3,500
Sq Ft
$210/Sq Ft
Est. Value
About This Home
This home is located at 7900 Lotus Ave, Morton Grove, IL 60053 and is currently estimated at $735,924, approximately $210 per square foot. 7900 Lotus Ave is a home located in Cook County with nearby schools including Madison Elementary School, Thomas Edison Elementary School, and Lincoln Junior High School.
Ownership History
Date
Name
Owned For
Owner Type
Purchase Details
Closed on
Jun 6, 2017
Sold by
Dupage National Bank
Bought by
Monnest Thomas
Current Estimated Value
Home Financials for this Owner
Home Financials are based on the most recent Mortgage that was taken out on this home.
Original Mortgage
$424,000
Interest Rate
3.94%
Mortgage Type
Unknown
Purchase Details
Closed on
May 26, 2017
Sold by
Miron Benjamin and Miron Aura
Bought by
Suriya Mohammed R and Guidance Residential Llc
Home Financials for this Owner
Home Financials are based on the most recent Mortgage that was taken out on this home.
Original Mortgage
$424,000
Interest Rate
3.94%
Mortgage Type
Unknown
Purchase Details
Closed on
Sep 26, 2012
Sold by
Miron Benjamin and Miron Aura
Bought by
Dupage National Bank
Purchase Details
Closed on
Dec 7, 2005
Sold by
Beckwith Elizabeth Anne
Bought by
Beckwith Elizabeth and Nolan Thomas E
Create a Home Valuation Report for This Property
The Home Valuation Report is an in-depth analysis detailing your home's value as well as a comparison with similar homes in the area
Home Values in the Area
Average Home Value in this Area
Purchase History
| Date | Buyer | Sale Price | Title Company |
|---|---|---|---|
| Monnest Thomas | -- | Chicago Title | |
| Suriya Mohammed R | $670,000 | Chicago Title | |
| Miron Benjamin | -- | Chicago Title | |
| Dupage National Bank | -- | None Available | |
| Beckwith Elizabeth | -- | None Available |
Source: Public Records
Mortgage History
| Date | Status | Borrower | Loan Amount |
|---|---|---|---|
| Previous Owner | Suriya Mohammed R | $424,000 |
Source: Public Records
Tax History Compared to Growth
Tax History
| Year | Tax Paid | Tax Assessment Tax Assessment Total Assessment is a certain percentage of the fair market value that is determined by local assessors to be the total taxable value of land and additions on the property. | Land | Improvement |
|---|---|---|---|---|
| 2024 | $9,339 | $28,314 | $4,875 | $23,439 |
| 2023 | $9,236 | $28,314 | $4,875 | $23,439 |
| 2022 | $9,236 | $28,314 | $4,875 | $23,439 |
| 2021 | $10,908 | $28,773 | $3,000 | $25,773 |
| 2020 | $10,793 | $28,773 | $3,000 | $25,773 |
| 2019 | $10,856 | $32,350 | $3,000 | $29,350 |
| 2018 | $9,997 | $26,636 | $2,718 | $23,918 |
| 2017 | $9,383 | $26,636 | $2,718 | $23,918 |
| 2016 | $8,965 | $26,636 | $2,718 | $23,918 |
| 2015 | $7,319 | $20,944 | $2,343 | $18,601 |
| 2014 | $7,653 | $20,944 | $2,343 | $18,601 |
| 2013 | $7,690 | $20,944 | $2,343 | $18,601 |
Source: Public Records
Map
Nearby Homes
- 5505 Oakton St
- 5501 Mulford St
- 5500 Harvard Terrace
- 5261 Mulford St
- 5251 Galitz St Unit 410
- 5251 Galitz St Unit 311
- 5207 Galitz St
- 8128 Laramie Ave
- 7848 Lincoln Ave
- 8306 Central Ave
- 5148 Cleveland St
- 5153 Dobson St
- 4953 Oakton St Unit 510
- 4953 Oakton St Unit P11
- 4953 Oakton St Unit 207
- 7507 Frontage Rd
- 5000 Oakton St Unit 505
- 7500 Laramie Ave
- 7748 Lincoln Ave
- 5501 Lincoln Ave Unit 203
- 7900 Lotus Ave
- 7906 Lotus Ave
- 7906 Lotus Ave
- 7912 Lotus Ave
- 7850 Lotus Ave
- 7850 Lotus Ave
- 5446 Kirk St
- 5446 Kirk St
- 7905 Linder Ave
- 7909 Linder Ave
- 7916 Lotus Ave
- 7916 Lotus Ave
- 7901 Lotus Ave
- 7901 Lotus Ave
- 7905 Lotus Ave
- 7847 Linder Ave
- 7842 Lotus Ave
- 7915 Linder Ave
- 7915 Linder Ave
- 7924 Lotus Ave