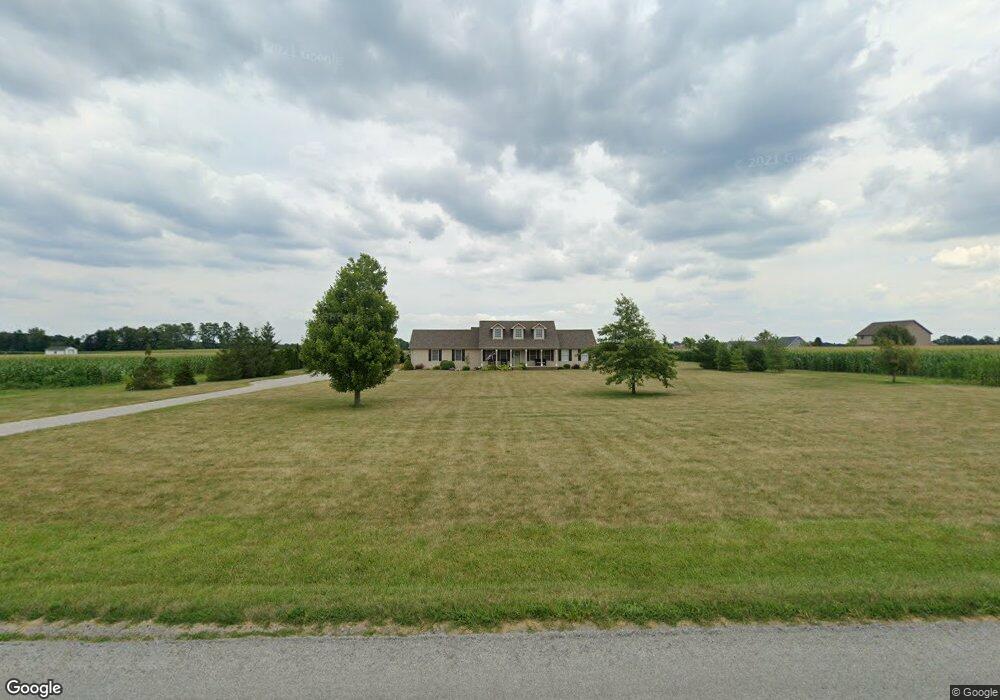
7900 S 200 E Lafayette, IN 47909
Estimated Value: $306,000 - $563,000
3
Beds
2
Baths
1,434
Sq Ft
$301/Sq Ft
Est. Value
About This Home
This home is located at 7900 S 200 E, Lafayette, IN 47909 and is currently estimated at $431,783, approximately $301 per square foot. 7900 S 200 E is a home located in Tippecanoe County with nearby schools including Woodland Elementary School, Wea Ridge Middle School, and McCutcheon High School.
Ownership History
Date
Name
Owned For
Owner Type
Purchase Details
Closed on
Jul 11, 2025
Sold by
Blankenship Brandon T and Blankenship Heather M
Bought by
Wilcox Nancy and Wilcox Philip
Current Estimated Value
Purchase Details
Closed on
Jun 18, 2004
Sold by
Steve Schrader Homes Llc
Bought by
Blankenship Brandon T and Blankenship Heather M
Home Financials for this Owner
Home Financials are based on the most recent Mortgage that was taken out on this home.
Original Mortgage
$172,251
Interest Rate
6.17%
Mortgage Type
Purchase Money Mortgage
Create a Home Valuation Report for This Property
The Home Valuation Report is an in-depth analysis detailing your home's value as well as a comparison with similar homes in the area
Purchase History
| Date | Buyer | Sale Price | Title Company |
|---|---|---|---|
| Wilcox Nancy | -- | Columbia Title | |
| Blankenship Brandon T | -- | -- |
Source: Public Records
Mortgage History
| Date | Status | Borrower | Loan Amount |
|---|---|---|---|
| Previous Owner | Blankenship Brandon T | $172,251 |
Source: Public Records
Tax History
| Year | Tax Paid | Tax Assessment Tax Assessment Total Assessment is a certain percentage of the fair market value that is determined by local assessors to be the total taxable value of land and additions on the property. | Land | Improvement |
|---|---|---|---|---|
| 2024 | $2,866 | $337,700 | $67,800 | $269,900 |
| 2023 | $2,681 | $321,800 | $64,200 | $257,600 |
| 2022 | $2,347 | $286,300 | $60,500 | $225,800 |
| 2021 | $2,101 | $258,000 | $58,400 | $199,600 |
| 2020 | $1,978 | $241,800 | $58,400 | $183,400 |
| 2019 | $1,850 | $236,200 | $61,000 | $175,200 |
| 2018 | $1,762 | $228,000 | $61,500 | $166,500 |
| 2017 | $1,716 | $222,400 | $63,700 | $158,700 |
| 2016 | $1,482 | $206,500 | $63,500 | $143,000 |
| 2014 | $1,352 | $196,600 | $63,500 | $133,100 |
| 2013 | $1,405 | $194,000 | $63,500 | $130,500 |
Source: Public Records
Map
Nearby Homes
Your Personal Tour Guide
Ask me questions while you tour the home.