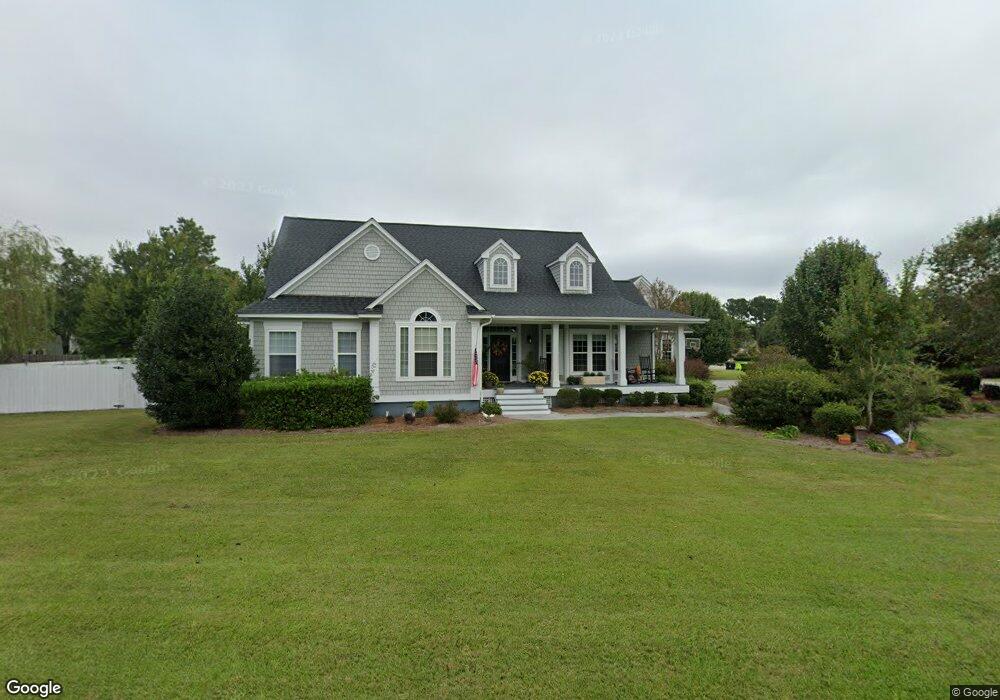
7900 Sanderling Place Wilmington, NC 28411
Estimated Value: $722,447 - $1,046,000
4
Beds
3
Baths
2,715
Sq Ft
$301/Sq Ft
Est. Value
About This Home
This home is located at 7900 Sanderling Place, Wilmington, NC 28411 and is currently estimated at $817,112, approximately $300 per square foot. 7900 Sanderling Place is a home located in New Hanover County with nearby schools including Porters Neck Elementary School, Holly Shelter Middle School, and Emsley A. Laney High School.
Ownership History
Date
Name
Owned For
Owner Type
Purchase Details
Closed on
Apr 25, 2018
Sold by
D & C Randall Llc
Bought by
Slm Properties Of Wilmington Llc
Current Estimated Value
Purchase Details
Closed on
Jun 28, 2011
Sold by
Fuss William H and Fuss Kathryn E
Bought by
Tysinger Raymond M and Tysinger Edith F
Purchase Details
Closed on
Jun 22, 2011
Sold by
Tysinger Raymond M and Tysinger Edith F
Bought by
Matt Sharon
Purchase Details
Closed on
Jan 19, 2001
Sold by
Fuss William H Kathryn E
Bought by
Tysinger Raymond H Edith F
Purchase Details
Closed on
Nov 20, 1998
Sold by
Murdock Construction Co
Bought by
Fuss William H Kathryn E
Purchase Details
Closed on
Nov 26, 1997
Sold by
Bayshore Estates Inc
Bought by
Murdock Construction Co
Purchase Details
Closed on
Mar 8, 1993
Sold by
Bayshore Estates Inc
Bought by
Nc Dept Of Transportation
Purchase Details
Closed on
May 1, 1961
Bought by
Bayshore Estates Inc
Create a Home Valuation Report for This Property
The Home Valuation Report is an in-depth analysis detailing your home's value as well as a comparison with similar homes in the area
Home Values in the Area
Average Home Value in this Area
Purchase History
| Date | Buyer | Sale Price | Title Company |
|---|---|---|---|
| Slm Properties Of Wilmington Llc | $650,000 | None Available | |
| Tysinger Raymond M | -- | None Available | |
| Matt Sharon | $370,000 | None Available | |
| Tysinger Raymond H Edith F | $328,000 | -- | |
| Fuss William H Kathryn E | $319,500 | -- | |
| Murdock Construction Co | $38,500 | -- | |
| Nc Dept Of Transportation | -- | -- | |
| Bayshore Estates Inc | -- | -- |
Source: Public Records
Tax History Compared to Growth
Tax History
| Year | Tax Paid | Tax Assessment Tax Assessment Total Assessment is a certain percentage of the fair market value that is determined by local assessors to be the total taxable value of land and additions on the property. | Land | Improvement |
|---|---|---|---|---|
| 2023 | $2,498 | $463,900 | $138,400 | $325,500 |
| 2022 | $0 | $463,900 | $138,400 | $325,500 |
| 2021 | $2,488 | $463,900 | $138,400 | $325,500 |
| 2020 | $2,488 | $393,400 | $95,200 | $298,200 |
| 2019 | $2,488 | $393,400 | $95,200 | $298,200 |
| 2018 | $0 | $393,400 | $95,200 | $298,200 |
| 2017 | $2,547 | $393,400 | $95,200 | $298,200 |
| 2016 | $2,493 | $359,700 | $95,200 | $264,500 |
| 2015 | $2,316 | $359,700 | $95,200 | $264,500 |
| 2014 | $2,277 | $359,700 | $95,200 | $264,500 |
Source: Public Records
Map
Nearby Homes
- 7907 Beaufort Ct
- 602 Southerland Farm Dr
- 208 Country Haven Dr Unit A
- 208 Country Haven Dr Unit B
- 208 Country Haven Dr Unit B
- 208 Country Haven Dr Unit A
- 660 Vale Dr
- 7843 Raintree
- 607 Trace Dr
- 633 Vale Dr
- 629 Vale Dr
- 7926 Cumberland Place
- 7834 Olde Pond Rd
- 8133 Porters Crossing Way
- 7846 Olde Pond Rd
- 546 Aquarius Dr
- 133 Graystone Rd
- 8238 Porters Crossing Way
- 161 Graystone Rd
- 430 Upland Dr
- 205 Marsh Oaks Dr
- 7904 Sanderling Place
- 7830 Sanderling Place
- 7901 Sanderling Place
- 209 Marsh Oaks Dr
- 7905 Sanderling Place
- 104 Koonce Ct
- 7828 Sanderling Place
- 7821 Marymount Dr
- 7908 Sanderling Place
- 204 Marsh Oaks Dr
- 106 Koonce Ct
- 7909 Sanderling Place
- 7826 Sanderling Place
- 7817 Marymount Dr
- 213 Marsh Oaks Dr
- 208 Marsh Oaks Dr
- 102 Koonce Ct
- 7824 Sanderling Place
- 7913 Sanderling Place