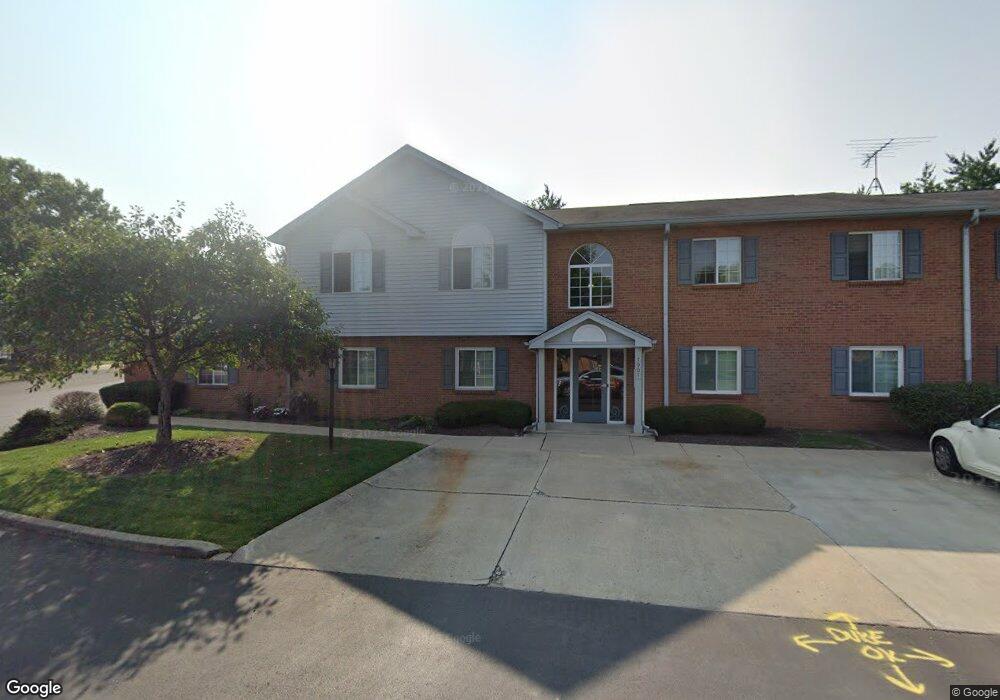
7901 Cheviot Rd Unit 4 Cincinnati, OH 45247
Estimated Value: $173,703 - $181,000
2
Beds
2
Baths
1,208
Sq Ft
$147/Sq Ft
Est. Value
About This Home
This home is located at 7901 Cheviot Rd Unit 4, Cincinnati, OH 45247 and is currently estimated at $177,926, approximately $147 per square foot. 7901 Cheviot Rd Unit 4 is a home located in Hamilton County with nearby schools including White Oak Middle School, Colerain High School, and St. James School.
Ownership History
Date
Name
Owned For
Owner Type
Purchase Details
Closed on
Mar 8, 2016
Sold by
Ralph E Neller
Bought by
Ballman Richard
Current Estimated Value
Home Financials for this Owner
Home Financials are based on the most recent Mortgage that was taken out on this home.
Original Mortgage
$44,000
Outstanding Balance
$34,431
Interest Rate
3.64%
Estimated Equity
$143,495
Purchase Details
Closed on
Mar 7, 2016
Sold by
Stigler Margie Ann
Bought by
Ballman Richard J
Home Financials for this Owner
Home Financials are based on the most recent Mortgage that was taken out on this home.
Original Mortgage
$44,000
Outstanding Balance
$34,431
Interest Rate
3.64%
Estimated Equity
$143,495
Purchase Details
Closed on
Oct 29, 2003
Sold by
Alexander Deborah A and Eugene Robert
Bought by
Neller Ralph and Neller Mary Ellen
Purchase Details
Closed on
Oct 17, 2000
Sold by
Clift Mary Ann and Clift Mary A
Bought by
Schweitzer Deborah A and Shibiya Tina M
Create a Home Valuation Report for This Property
The Home Valuation Report is an in-depth analysis detailing your home's value as well as a comparison with similar homes in the area
Home Values in the Area
Average Home Value in this Area
Purchase History
| Date | Buyer | Sale Price | Title Company |
|---|---|---|---|
| Ballman Richard | -- | -- | |
| Ballman Richard J | $55,000 | -- | |
| Neller Ralph | $97,500 | -- | |
| Schweitzer Deborah A | -- | -- |
Source: Public Records
Mortgage History
| Date | Status | Borrower | Loan Amount |
|---|---|---|---|
| Open | Ballman Richard J | $44,000 | |
| Closed | Ballman Richard J | -- | |
| Closed | Ballman Richard J | -- |
Source: Public Records
Tax History
| Year | Tax Paid | Tax Assessment Tax Assessment Total Assessment is a certain percentage of the fair market value that is determined by local assessors to be the total taxable value of land and additions on the property. | Land | Improvement |
|---|---|---|---|---|
| 2025 | $1,869 | $42,557 | $6,650 | $35,907 |
| 2024 | $1,739 | $42,557 | $6,650 | $35,907 |
| 2023 | $1,793 | $42,557 | $6,650 | $35,907 |
| 2022 | $1,483 | $31,266 | $7,168 | $24,098 |
| 2021 | $1,462 | $31,266 | $7,168 | $24,098 |
| 2020 | $1,488 | $31,266 | $7,168 | $24,098 |
| 2019 | $745 | $19,250 | $5,600 | $13,650 |
| 2018 | $669 | $19,250 | $5,600 | $13,650 |
| 2017 | $628 | $19,250 | $5,600 | $13,650 |
| 2016 | $971 | $24,875 | $3,976 | $20,899 |
| 2015 | $987 | $24,875 | $3,976 | $20,899 |
| 2014 | $989 | $24,875 | $3,976 | $20,899 |
| 2013 | $1,535 | $35,035 | $5,600 | $29,435 |
Source: Public Records
Map
Nearby Homes
- 3693 W Galbraith Rd
- 3691 W Galbraith Rd
- 3701 W Galbraith Rd
- 3633 Twinview Dr
- 8261 Cheviot Rd
- 3408 Rocker Dr
- 3397 Nandale Dr
- 3937 Olde Savannah Dr Unit 3937
- 3663 Sandralin Dr
- 3727 Hanley Rd
- 3510 Banning Rd
- 3970 Olde Savannah Dr
- 3950 Olde Savannah Dr
- 4095 Philnoll Dr
- 3336 Nandale Dr
- 4021 Hanley Rd
- 3329 Alexis Rd
- 6724 Cheviot Rd
- 3269 Warfield Ave
- 3631 Semloh Ave
- 7901 Cheviot Rd Unit 3
- 7901 Cheviot Rd
- 7901 Cheviot Rd
- 7901 Cheviot Rd Unit 2
- 7901 Cheviot Rd Unit 1
- 7909 Cheviot Rd Unit 18
- 7909 Cheviot Rd Unit 17
- 7909 Cheviot Rd
- 7911 Cheviot Rd
- 7911 Cheviot Rd
- 7911 Cheviot Rd
- 7909 Cheviot Rd
- 7911 Cheviot Rd
- 7911 Cheviot Rd Unit 22
- 7909 Cheviot Rd Unit 19
- 7911 Cheviot Rd Unit 23
- 7909 Cheviot Rd Unit 20
- 7911 Cheviot Rd Unit 21
- 7907 Cheviot Rd
- 7907 Cheviot Rd
Your Personal Tour Guide
Ask me questions while you tour the home.