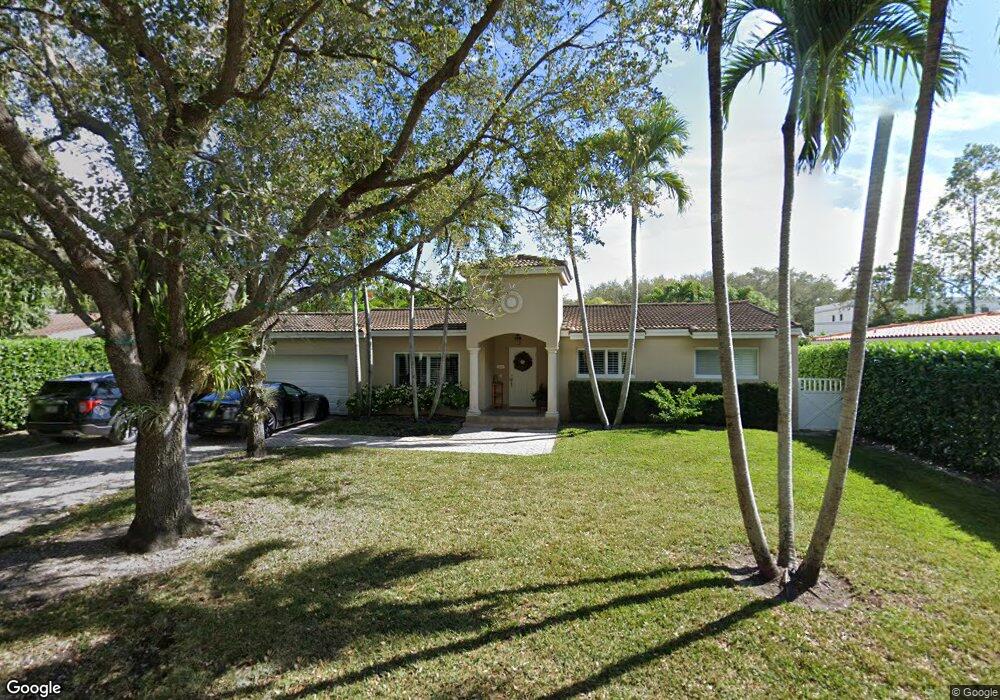
7901 SW 53rd Ave Miami, FL 33143
South Miami-Kendall NeighborhoodEstimated Value: $1,977,000 - $3,059,000
4
Beds
3
Baths
3,194
Sq Ft
$784/Sq Ft
Est. Value
About This Home
This home is located at 7901 SW 53rd Ave, Miami, FL 33143 and is currently estimated at $2,503,188, approximately $783 per square foot. 7901 SW 53rd Ave is a home located in Miami-Dade County with nearby schools including Sunset Elementary School, Ponce de Leon Middle School, and Coral Gables Senior High School.
Ownership History
Date
Name
Owned For
Owner Type
Purchase Details
Closed on
Sep 20, 2006
Sold by
Paleologos Celia
Bought by
Dann Sara
Current Estimated Value
Home Financials for this Owner
Home Financials are based on the most recent Mortgage that was taken out on this home.
Original Mortgage
$900,000
Outstanding Balance
$533,977
Interest Rate
6.45%
Mortgage Type
Unknown
Estimated Equity
$1,969,211
Purchase Details
Closed on
Aug 12, 2005
Sold by
Sollie Eddie C and Sollie Cynthia Zale
Bought by
Paleologos Celia
Purchase Details
Closed on
Apr 30, 2001
Sold by
Silvio Vazquez M and Silvio Monica R
Bought by
Sollie Eddie C and Sollie Cynthia Z
Home Financials for this Owner
Home Financials are based on the most recent Mortgage that was taken out on this home.
Original Mortgage
$24,000
Interest Rate
7.05%
Mortgage Type
Credit Line Revolving
Purchase Details
Closed on
Feb 15, 2000
Sold by
Littlefield Doris B
Bought by
Vazquez Silvio and Restrepo Monica
Create a Home Valuation Report for This Property
The Home Valuation Report is an in-depth analysis detailing your home's value as well as a comparison with similar homes in the area
Home Values in the Area
Average Home Value in this Area
Purchase History
| Date | Buyer | Sale Price | Title Company |
|---|---|---|---|
| Dann Sara | $1,125,000 | Attorney | |
| Paleologos Celia | $1,075,000 | -- | |
| Sollie Eddie C | $595,000 | -- | |
| Vazquez Silvio | $265,000 | -- |
Source: Public Records
Mortgage History
| Date | Status | Borrower | Loan Amount |
|---|---|---|---|
| Open | Dann Sara | $900,000 | |
| Previous Owner | Vazquez Silvio | $24,000 | |
| Previous Owner | Vazquez Silvio | $73,000 | |
| Previous Owner | Vazquez Silvio | $211,200 |
Source: Public Records
Tax History Compared to Growth
Tax History
| Year | Tax Paid | Tax Assessment Tax Assessment Total Assessment is a certain percentage of the fair market value that is determined by local assessors to be the total taxable value of land and additions on the property. | Land | Improvement |
|---|---|---|---|---|
| 2025 | $13,119 | $795,617 | -- | -- |
| 2024 | $12,664 | $773,195 | -- | -- |
| 2023 | $12,664 | $750,675 | $0 | $0 |
| 2022 | $12,243 | $728,811 | $0 | $0 |
| 2021 | $12,236 | $707,584 | $0 | $0 |
| 2020 | $12,101 | $697,815 | $0 | $0 |
| 2019 | $11,855 | $682,127 | $0 | $0 |
| 2018 | $11,326 | $669,409 | $0 | $0 |
| 2017 | $11,244 | $655,641 | $0 | $0 |
| 2016 | $11,063 | $633,561 | $0 | $0 |
| 2015 | $11,203 | $629,157 | $0 | $0 |
| 2014 | -- | $624,164 | $0 | $0 |
Source: Public Records
Map
Nearby Homes
- 7930 SW 52nd Ct
- 7965 SW 53rd Ave
- 7975 SW 52nd Ct
- 5286 SW 80th St
- 7925 SW 54th Ave
- 8150 SW 52nd Ave
- 7900 SW 54th Ave
- 5095 SW 82nd St
- 7575 SW 54th Ave
- 7454 SW 52nd Ave
- 8301 SW 53rd Ave
- 8252 SW 52nd Ave
- 5345 SW 84th St
- 7402 SW 54th Ave
- 7360 SW 53rd Place
- 4920 SW 76th St
- 7620 SW 56th Ave Unit 4
- 7700 SW 56th Ave Unit 4
- 5320 Sunset Dr
- 5001 Pine Dr
- 7925 SW 53rd Ave
- 7861 SW 53rd Ave
- 7860 SW 52nd Ct
- 7900 SW 52nd Ct
- 7945 SW 53rd Ave
- 7900 SW 53rd Ave
- 7840 SW 53rd Ave
- 7910 SW 53rd Ave
- 7830 SW 52nd Ct
- 7820 SW 53rd Ave
- 7920 SW 53rd Ave
- 7801 SW 53rd Ave
- 5260 SW 78th St
- 5265 SW 80th St
- 7800 SW 53rd Ave
- 7901 SW 53rd Ct
- 7800 SW 52nd Ct
- 7960 SW 52nd Ct
- 7845 SW 53rd Ct