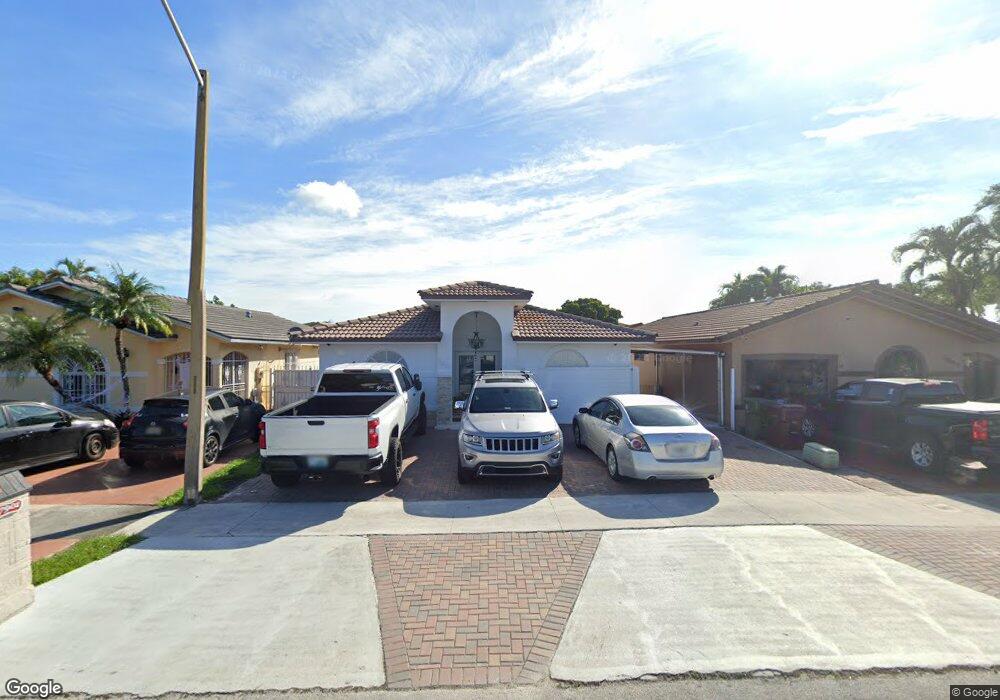
7901 W 30th Ln Hialeah, FL 33018
Estimated Value: $529,000 - $563,000
3
Beds
2
Baths
1,480
Sq Ft
$366/Sq Ft
Est. Value
About This Home
This home is located at 7901 W 30th Ln, Hialeah, FL 33018 and is currently estimated at $541,363, approximately $365 per square foot. 7901 W 30th Ln is a home located in Miami-Dade County with nearby schools including Ernest R. Graham K-8 Academy, Hialeah Gardens Middle School, and Barbara Goleman Senior High School.
Ownership History
Date
Name
Owned For
Owner Type
Purchase Details
Closed on
Feb 15, 2016
Sold by
Hernandez Jose Torres and Torres Carlos
Bought by
Hernandez Jose Torres and Torres Carlos
Current Estimated Value
Purchase Details
Closed on
Aug 26, 2010
Sold by
Us Bank National Association
Bought by
Hernandez Jose Torres and Torres Carlos
Home Financials for this Owner
Home Financials are based on the most recent Mortgage that was taken out on this home.
Original Mortgage
$168,896
Interest Rate
4.87%
Mortgage Type
FHA
Purchase Details
Closed on
May 14, 2010
Sold by
Torres Lorena A
Bought by
Us Bank National Association
Purchase Details
Closed on
Jan 31, 2007
Sold by
Rincon Mario and Rincon Regina A
Bought by
Torres Lorena A
Home Financials for this Owner
Home Financials are based on the most recent Mortgage that was taken out on this home.
Original Mortgage
$262,400
Interest Rate
7.83%
Mortgage Type
Unknown
Create a Home Valuation Report for This Property
The Home Valuation Report is an in-depth analysis detailing your home's value as well as a comparison with similar homes in the area
Home Values in the Area
Average Home Value in this Area
Purchase History
| Date | Buyer | Sale Price | Title Company |
|---|---|---|---|
| Hernandez Jose Torres | -- | None Listed On Document | |
| Hernandez Jose Torres | $171,200 | Attorney | |
| Us Bank National Association | $119,700 | None Available | |
| Torres Lorena A | $328,000 | Attorney |
Source: Public Records
Mortgage History
| Date | Status | Borrower | Loan Amount |
|---|---|---|---|
| Previous Owner | Hernandez Jose Torres | $168,896 | |
| Previous Owner | Torres Lorena A | $262,400 |
Source: Public Records
Tax History
| Year | Tax Paid | Tax Assessment Tax Assessment Total Assessment is a certain percentage of the fair market value that is determined by local assessors to be the total taxable value of land and additions on the property. | Land | Improvement |
|---|---|---|---|---|
| 2025 | $2,778 | $195,494 | -- | -- |
| 2024 | $2,691 | $189,985 | -- | -- |
| 2023 | $2,691 | $184,452 | $0 | $0 |
| 2022 | $2,586 | $179,080 | $0 | $0 |
| 2021 | $2,563 | $173,865 | $0 | $0 |
| 2020 | $2,442 | $167,144 | $0 | $0 |
| 2019 | $2,375 | $163,387 | $0 | $0 |
| 2018 | $2,257 | $160,341 | $0 | $0 |
| 2017 | $2,227 | $157,044 | $0 | $0 |
| 2016 | $2,213 | $153,814 | $0 | $0 |
| 2015 | $2,237 | $152,745 | $0 | $0 |
| 2014 | $2,262 | $151,533 | $0 | $0 |
Source: Public Records
Map
Nearby Homes
- 3021 W 76th St Unit C201
- 7724 W 29th Ln Unit 10138
- 7579 W 31st Ave
- 3011 W 76th St Unit A104
- 7801 W 29th Way Unit 102
- 7792 W 29th Way Unit 202
- 7603 W 29th Ln Unit 20255
- 7795 W 29th Way Unit 201
- 7462 W 29th Way
- 2815 W 76th St Unit 20217
- 7185 W 30th Ln
- 2780 W 76th St Unit 205
- 2780 W 76th St Unit 203
- 3118 W 71st Place
- 7842 W 34th Ln Unit 202
- 3203 W 70th Terrace
- 7762 W 34th Ln Unit 18202
- 2690 W 76th St Unit 104
- 2755 W 74th St
- 2710 W 76th St Unit 207
Your Personal Tour Guide
Ask me questions while you tour the home.