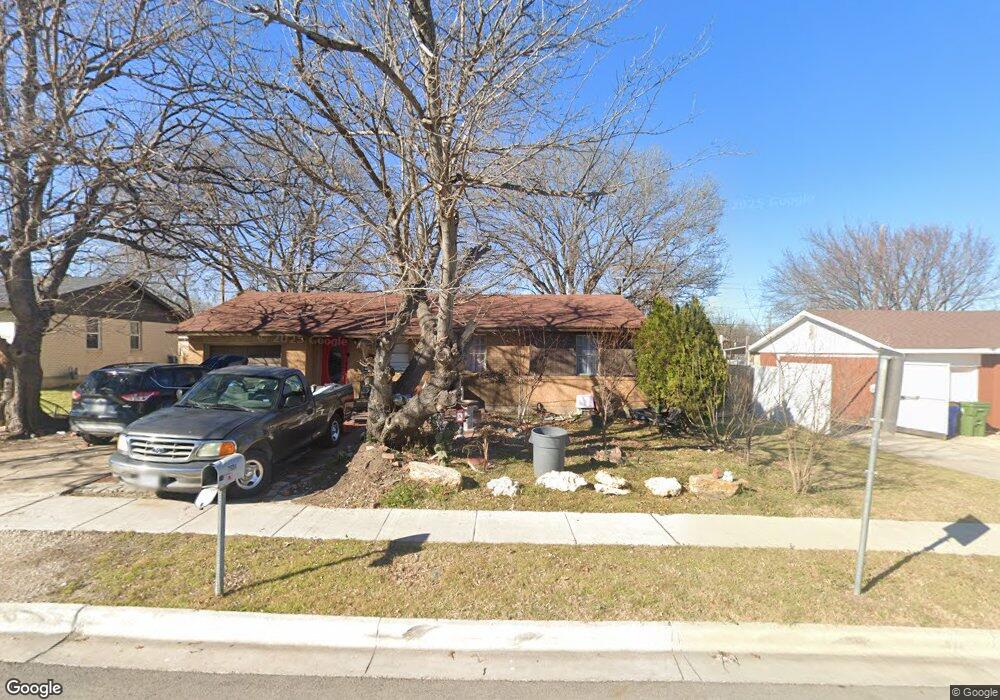
7904 Tumbleweed Trail Fort Worth, TX 76108
Estimated Value: $186,000 - $223,000
3
Beds
1
Bath
918
Sq Ft
$216/Sq Ft
Est. Value
About This Home
This home is located at 7904 Tumbleweed Trail, Fort Worth, TX 76108 and is currently estimated at $197,961, approximately $215 per square foot. 7904 Tumbleweed Trail is a home located in Tarrant County with nearby schools including Liberty Elementary School, Brewer Middle School, and Tannahill Intermediate School.
Ownership History
Date
Name
Owned For
Owner Type
Purchase Details
Closed on
Jun 30, 2015
Sold by
Smith Coryell L and Adams Freda F
Bought by
Robledo Tito and Robledo Maria
Current Estimated Value
Purchase Details
Closed on
May 22, 2015
Sold by
Smith Robert Shane
Bought by
Smith Coryell L and Adams Freda F
Purchase Details
Closed on
Aug 26, 2013
Sold by
Smith Robert Shane
Bought by
Smith Coryell Leigh and Adams Freda
Purchase Details
Closed on
Mar 4, 2008
Sold by
Hyzer Robert W and Hyzer Bryony L
Bought by
Smith Robert Shane and Smith Corvell L
Home Financials for this Owner
Home Financials are based on the most recent Mortgage that was taken out on this home.
Original Mortgage
$55,000
Interest Rate
5.72%
Mortgage Type
Purchase Money Mortgage
Purchase Details
Closed on
Aug 6, 1995
Sold by
Stallings Johnny Lee and Stallings Rudy Edford
Bought by
Stallings Dovey Aldene
Create a Home Valuation Report for This Property
The Home Valuation Report is an in-depth analysis detailing your home's value as well as a comparison with similar homes in the area
Home Values in the Area
Average Home Value in this Area
Purchase History
| Date | Buyer | Sale Price | Title Company |
|---|---|---|---|
| Robledo Tito | -- | Attorney | |
| Smith Coryell L | -- | None Available | |
| Smith Coryell Leigh | -- | None Available | |
| Smith Robert Shane | -- | Title Team Of Texas | |
| Stallings Dovey Aldene | -- | Trinity Western Title Co |
Source: Public Records
Mortgage History
| Date | Status | Borrower | Loan Amount |
|---|---|---|---|
| Previous Owner | Smith Robert Shane | $55,000 |
Source: Public Records
Tax History Compared to Growth
Tax History
| Year | Tax Paid | Tax Assessment Tax Assessment Total Assessment is a certain percentage of the fair market value that is determined by local assessors to be the total taxable value of land and additions on the property. | Land | Improvement |
|---|---|---|---|---|
| 2025 | $768 | $193,127 | $45,510 | $147,617 |
| 2024 | $768 | $193,127 | $45,510 | $147,617 |
| 2023 | $3,480 | $187,318 | $45,510 | $141,808 |
| 2022 | $3,603 | $140,198 | $25,000 | $115,198 |
| 2021 | $3,327 | $126,247 | $25,000 | $101,247 |
| 2020 | $3,047 | $109,965 | $25,000 | $84,965 |
| 2019 | $2,995 | $104,439 | $25,000 | $79,439 |
| 2018 | $446 | $94,639 | $12,000 | $82,639 |
| 2017 | $2,643 | $90,444 | $12,000 | $78,444 |
| 2016 | $2,478 | $84,799 | $12,000 | $72,799 |
| 2015 | -- | $45,300 | $9,000 | $36,300 |
| 2014 | -- | $45,300 | $9,000 | $36,300 |
Source: Public Records
Map
Nearby Homes
- 7908 Tumbleweed Trail
- 7900 Tumbleweed Trail
- 7905 Downe Dr
- 7909 Downe Dr
- 7912 Tumbleweed Trail
- 7901 Downe Dr
- 7913 Downe Dr
- 7905 Tumbleweed Trail
- 7901 Tumbleweed Trail
- 7909 Tumbleweed Trail
- 7917 Downe Dr
- 7916 Tumbleweed Trail
- 7913 Tumbleweed Trail
- 7921 Downe Dr
- 1405 S Cherry Ln
- 7917 Tumbleweed Trail
- 7920 Tumbleweed Trail
- 7904 Chaparral Dr
- 7904 Downe Dr
- 7908 Downe Dr