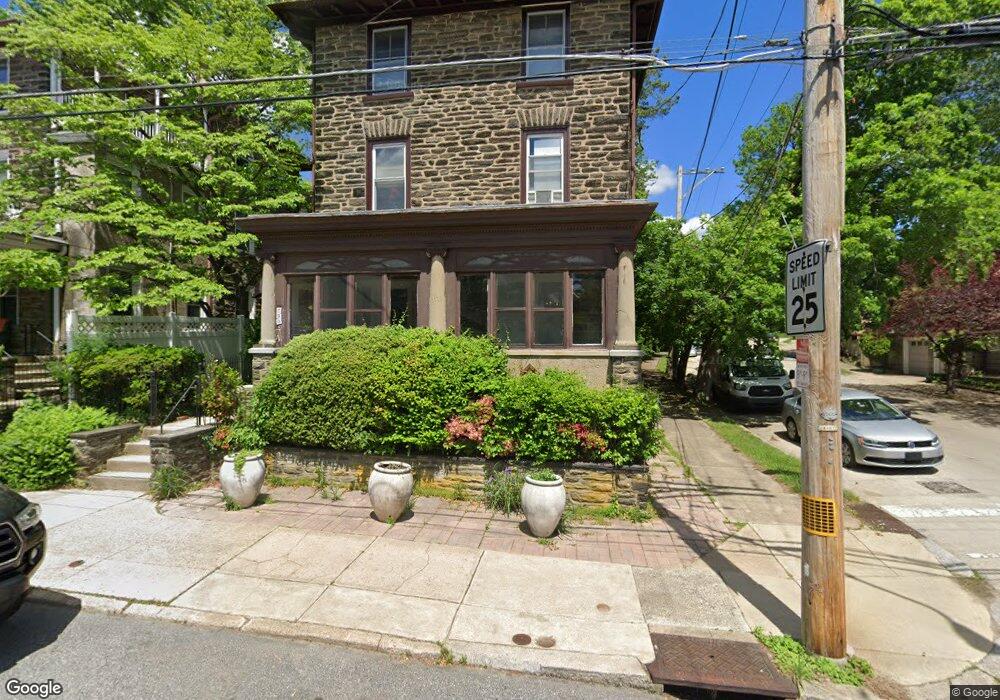
7905 Ardleigh St Unit 3RD FL Philadelphia, PA 19118
Chestnut Hill NeighborhoodEstimated Value: $637,000 - $717,019
1
Bed
1
Bath
2,467
Sq Ft
$272/Sq Ft
Est. Value
About This Home
This home is located at 7905 Ardleigh St Unit 3RD FL, Philadelphia, PA 19118 and is currently estimated at $670,340, approximately $271 per square foot. 7905 Ardleigh St Unit 3RD FL is a home located in Philadelphia County with nearby schools including John Story Jenks Academy for the Arts an, Roxborough High School, and Renaissance Charter School.
Ownership History
Date
Name
Owned For
Owner Type
Purchase Details
Closed on
Sep 6, 2006
Sold by
Siegel Christopher and Siegel Maureen
Bought by
Thorne George T
Current Estimated Value
Home Financials for this Owner
Home Financials are based on the most recent Mortgage that was taken out on this home.
Original Mortgage
$255,000
Outstanding Balance
$152,682
Interest Rate
6.71%
Mortgage Type
Commercial
Estimated Equity
$517,658
Purchase Details
Closed on
Dec 14, 2000
Sold by
Koeing Lynne P and Phillips Esther L
Bought by
Siegel Christopher and Siegel Maureen
Home Financials for this Owner
Home Financials are based on the most recent Mortgage that was taken out on this home.
Original Mortgage
$186,800
Interest Rate
6.66%
Mortgage Type
FHA
Create a Home Valuation Report for This Property
The Home Valuation Report is an in-depth analysis detailing your home's value as well as a comparison with similar homes in the area
Home Values in the Area
Average Home Value in this Area
Purchase History
| Date | Buyer | Sale Price | Title Company |
|---|---|---|---|
| Thorne George T | $340,000 | T A Title Insurance Co | |
| Siegel Christopher | $203,000 | -- |
Source: Public Records
Mortgage History
| Date | Status | Borrower | Loan Amount |
|---|---|---|---|
| Open | Thorne George T | $255,000 | |
| Previous Owner | Siegel Christopher | $186,800 |
Source: Public Records
Tax History Compared to Growth
Tax History
| Year | Tax Paid | Tax Assessment Tax Assessment Total Assessment is a certain percentage of the fair market value that is determined by local assessors to be the total taxable value of land and additions on the property. | Land | Improvement |
|---|---|---|---|---|
| 2026 | $5,179 | $496,000 | $99,200 | $396,800 |
| 2025 | $5,179 | $496,000 | $99,200 | $396,800 |
| 2024 | $5,179 | $496,000 | $99,200 | $396,800 |
| 2023 | $5,179 | $370,000 | $74,000 | $296,000 |
| 2022 | $5,209 | $370,000 | $74,000 | $296,000 |
| 2021 | $5,209 | $0 | $0 | $0 |
| 2020 | $5,209 | $0 | $0 | $0 |
| 2019 | $5,139 | $0 | $0 | $0 |
| 2018 | $3,971 | $0 | $0 | $0 |
| 2017 | $3,971 | $0 | $0 | $0 |
| 2016 | $3,971 | $0 | $0 | $0 |
| 2015 | $3,802 | $0 | $0 | $0 |
| 2014 | -- | $283,700 | $53,828 | $229,872 |
| 2012 | -- | $40,000 | $6,096 | $33,904 |
Source: Public Records
Map
Nearby Homes
- 246 E Springfield Ave
- 8004 Anderson St
- 8100 Germantown Ave Unit B
- 8100 Germantown Ave Unit A
- 1 W Hartwell Ln Unit 3C
- 1 W Hartwell Ln Unit PH1
- 7601 Crittenden St Unit A4
- 8207 Shawnee St
- 8215 Shawnee St
- 109 W Moreland Ave
- 302 Crest Park Rd
- 117 W Gravers Ln
- 8023 Seminole St
- 7510 Boyer St
- 7604 East Ln
- 310 E Evergreen Ave
- 318 W Springfield Ave
- 191 E Evergreen Ave
- 400 E Evergreen Ave
- 8610 Evergreen Place Unit 100
- 7905 Ardleigh St Unit 1ST FL
- 7905 Ardleigh St Unit 2ND FL
- 7905 Ardleigh St Unit 1
- 7905 Ardleigh St Unit 2
- 7905 Ardleigh St
- 7905 Ardleigh St Unit 3
- 7909 Ardleigh St
- 7911 Ardleigh St
- 206 E Benezet St
- 196 E Benezet St
- 212 E Benezet St
- 192 E Benezet St
- 7827 Ardleigh St
- 7828 Ardleigh St
- 218 E Benezet St
- 7823 Ardleigh St
- 7912-14 Ardleigh St
- 7826 Ardleigh St
- 7912 Ardleigh St Unit 14
- 203 E Benezet St