Estimated Value: $275,000 - $312,000
--
Bed
2
Baths
1,726
Sq Ft
$170/Sq Ft
Est. Value
About This Home
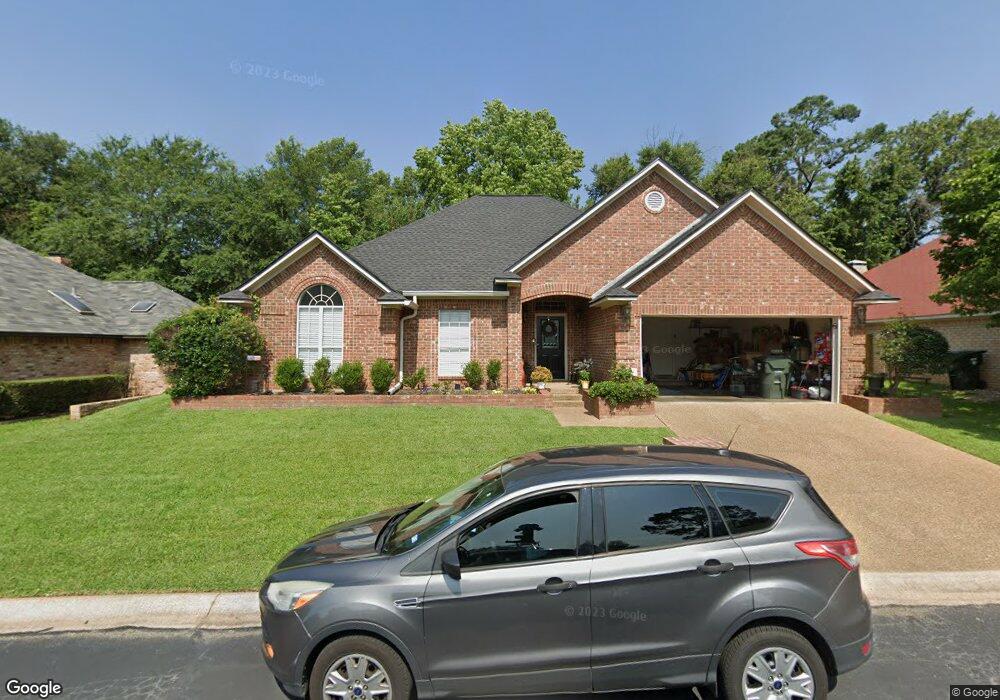
This home is located at 7905 Camden Passage, Tyler, TX 75703 and is currently estimated at $293,280, approximately $169 per square foot. 7905 Camden Passage is a home located in Smith County with nearby schools including Rice Elementary School, Hubbard Middle School, and Tyler Legacy High School.
Ownership History
Date
Name
Owned For
Owner Type
Purchase Details
Closed on
May 17, 2022
Sold by
Simpson Blake E and Simpson Whitney
Bought by
Hampton Donna
Current Estimated Value
Home Financials for this Owner
Home Financials are based on the most recent Mortgage that was taken out on this home.
Original Mortgage
$75,000
Outstanding Balance
$71,178
Interest Rate
5.3%
Mortgage Type
New Conventional
Estimated Equity
$222,102
Purchase Details
Closed on
Aug 19, 2011
Sold by
Armstrong Lee
Bought by
Simpson Blake E
Home Financials for this Owner
Home Financials are based on the most recent Mortgage that was taken out on this home.
Original Mortgage
$130,000
Interest Rate
4.65%
Mortgage Type
New Conventional
Create a Home Valuation Report for This Property
The Home Valuation Report is an in-depth analysis detailing your home's value as well as a comparison with similar homes in the area
Home Values in the Area
Average Home Value in this Area
Purchase History
| Date | Buyer | Sale Price | Title Company |
|---|---|---|---|
| Hampton Donna | -- | Terry & Hene Pllc | |
| Simpson Blake E | -- | None Available |
Source: Public Records
Mortgage History
| Date | Status | Borrower | Loan Amount |
|---|---|---|---|
| Open | Hampton Donna | $75,000 | |
| Previous Owner | Simpson Blake E | $130,000 |
Source: Public Records
Tax History Compared to Growth
Tax History
| Year | Tax Paid | Tax Assessment Tax Assessment Total Assessment is a certain percentage of the fair market value that is determined by local assessors to be the total taxable value of land and additions on the property. | Land | Improvement |
|---|---|---|---|---|
| 2025 | $1,268 | $247,498 | $33,624 | $213,874 |
| 2024 | $1,268 | $270,344 | $39,705 | $230,639 |
| 2023 | $4,287 | $245,903 | $39,705 | $206,198 |
| 2022 | $4,136 | $224,419 | $26,470 | $197,949 |
| 2021 | $4,027 | $209,147 | $26,470 | $182,677 |
| 2020 | $3,734 | $174,484 | $26,470 | $148,014 |
| 2019 | $3,682 | $168,384 | $26,470 | $141,914 |
| 2018 | $3,444 | $158,330 | $26,470 | $131,860 |
| 2017 | $3,246 | $152,051 | $26,470 | $125,581 |
| 2016 | $3,143 | $147,236 | $26,470 | $120,766 |
| 2015 | $2,782 | $146,009 | $26,470 | $119,539 |
| 2014 | $2,782 | $142,083 | $26,470 | $115,613 |
Source: Public Records
Map
Nearby Homes
- 308 Canterbury Ct
- 419 Wilder Way
- 7889 Greenhill Dr
- 8310 Columbia Dr
- 8412 Crooked Trail
- 8416 Crooked Trail
- 628 Wilder Way
- 231 W Cumberland Rd
- The Beckham Plan at Cumberland Place West
- The Tanglewood Plan at Cumberland Place West
- The Augusta Plan at Cumberland Place West
- The Donnybrook Plan at Cumberland Place West
- The Charnwood Plan at Cumberland Place West
- The Belmont Plan at Cumberland Place West
- The Tanglewood Plus Plan at Cumberland Place West
- The Elgem Plan at Cumberland Place West
- The Glenwood Plan at Cumberland Place West
- The Drexel Plan at Cumberland Place West
- The Elgem Plus Plan at Cumberland Place West
- The Cumberland Plan at Cumberland Place West
- 7903 Camden Passage
- 7907 Camden Passage
- 7907 Camden Passage Ln
- 7903 Camden Passage Ln
- 7909 Camden Passage
- 306 Amesbury Place
- 201 Lansdowne Terrace
- 207 Lansdowne Terrace
- 7809 Abbey Ct
- 7809 7809 Abbey Ct
- 303 Canterbury Ct
- 7904 Chancery Ln
- 7807 Abbey Ct
- 7807 7807 Abbey Ct
- 204 Lansdowne Terrace
- 7902 7902 Chancery
- 7902 Chancery Ln
- 202 Lansdowne Terrace
- 7908 Chancery Ln
- 305 Canterbury Ct