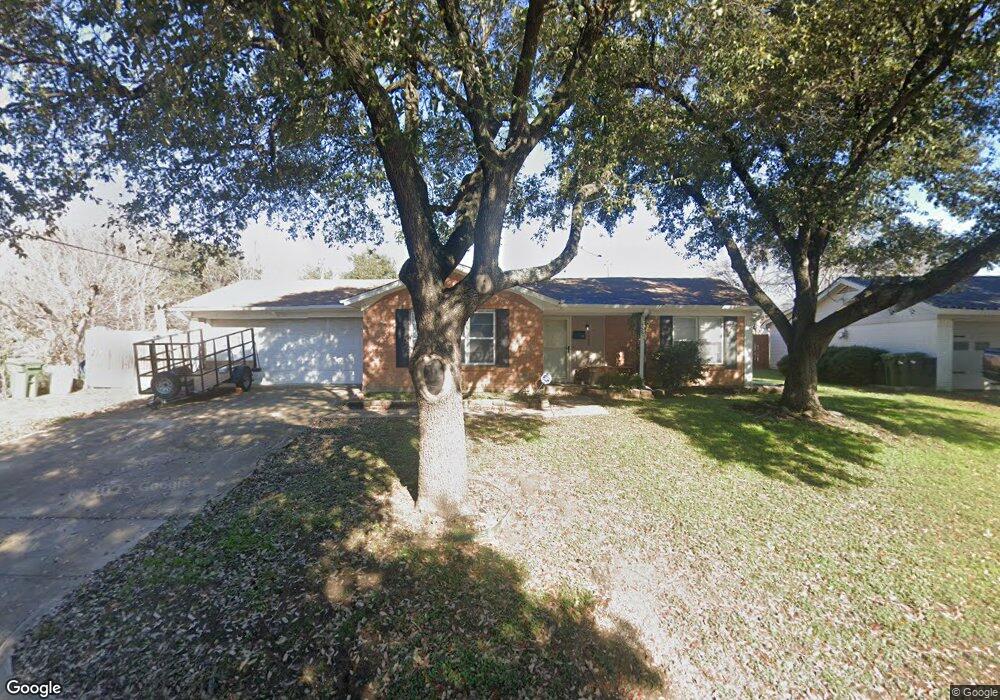
7905 Joreen Dr North Richland Hills, TX 76180
Estimated Value: $242,886 - $276,000
3
Beds
2
Baths
1,281
Sq Ft
$207/Sq Ft
Est. Value
About This Home
This home is located at 7905 Joreen Dr, North Richland Hills, TX 76180 and is currently estimated at $264,972, approximately $206 per square foot. 7905 Joreen Dr is a home located in Tarrant County with nearby schools including Academy at C.F. Thomas Elementary, Richland Middle School, and Birdville High School.
Ownership History
Date
Name
Owned For
Owner Type
Purchase Details
Closed on
Nov 7, 2025
Sold by
Adrig Rentals Llc
Bought by
Ash Bari Llc
Current Estimated Value
Purchase Details
Closed on
Jan 16, 2017
Sold by
Adrig Debora L
Bought by
Adrig Rentals Lc
Purchase Details
Closed on
Dec 30, 2015
Sold by
Memphis Invest Gp
Bought by
Adrig Debora L
Home Financials for this Owner
Home Financials are based on the most recent Mortgage that was taken out on this home.
Original Mortgage
$109,520
Interest Rate
3.98%
Mortgage Type
New Conventional
Purchase Details
Closed on
Aug 27, 2015
Sold by
Thompson Daniel D and Thompson Donna M
Bought by
Memphis Invest Gp
Purchase Details
Closed on
Nov 30, 1993
Sold by
Wells Michael A and Wells Cheryl Dahman
Bought by
Thompson Daniel D and Thompson Donna M
Home Financials for this Owner
Home Financials are based on the most recent Mortgage that was taken out on this home.
Original Mortgage
$55,324
Interest Rate
6.86%
Mortgage Type
FHA
Create a Home Valuation Report for This Property
The Home Valuation Report is an in-depth analysis detailing your home's value as well as a comparison with similar homes in the area
Home Values in the Area
Average Home Value in this Area
Purchase History
| Date | Buyer | Sale Price | Title Company |
|---|---|---|---|
| Ash Bari Llc | -- | Independence Title | |
| Adrig Rentals Lc | -- | None Available | |
| Adrig Debora L | -- | None Available | |
| Memphis Invest Gp | -- | Providence Title Company | |
| Thompson Daniel D | -- | Trinity Western Title Co |
Source: Public Records
Mortgage History
| Date | Status | Borrower | Loan Amount |
|---|---|---|---|
| Previous Owner | Adrig Debora L | $109,520 | |
| Previous Owner | Thompson Daniel D | $55,324 |
Source: Public Records
Tax History Compared to Growth
Tax History
| Year | Tax Paid | Tax Assessment Tax Assessment Total Assessment is a certain percentage of the fair market value that is determined by local assessors to be the total taxable value of land and additions on the property. | Land | Improvement |
|---|---|---|---|---|
| 2025 | $4,080 | $173,000 | $45,000 | $128,000 |
| 2024 | $4,080 | $188,000 | $45,000 | $143,000 |
| 2023 | $4,267 | $194,526 | $45,000 | $149,526 |
| 2022 | $3,948 | $164,084 | $23,000 | $141,084 |
| 2021 | $4,021 | $158,033 | $23,000 | $135,033 |
| 2020 | $3,359 | $132,000 | $23,000 | $109,000 |
| 2019 | $3,476 | $132,000 | $23,000 | $109,000 |
| 2018 | $3,186 | $121,000 | $23,000 | $98,000 |
| 2017 | $3,220 | $119,685 | $23,000 | $96,685 |
| 2016 | $2,132 | $79,226 | $15,000 | $64,226 |
| 2015 | $1,357 | $60,600 | $15,000 | $45,600 |
| 2014 | $1,357 | $60,600 | $15,000 | $45,600 |
Source: Public Records
Map
Nearby Homes
- 5113 Bob Dr
- 5304 Colorado Blvd
- 5020 Colorado Blvd
- 8020 Laura St
- 7717 Janetta Dr
- 5336 Davis Blvd
- 5016 Wyoming Trail
- 5108 Nancy Ln
- 7908 Lazy Lane Rd
- 5320 Topper Dr
- 4916 Susan Lee Ln
- 5024 Maryanna Way
- 8417 Emerald Cir
- 5117 Maryanna Way
- 7821 Davis Blvd
- 8304 Emerald Cir
- 7529 Susan Ct
- 7521 Susan Ct
- 5016 Winder Ct
- 7501 Lola Dr