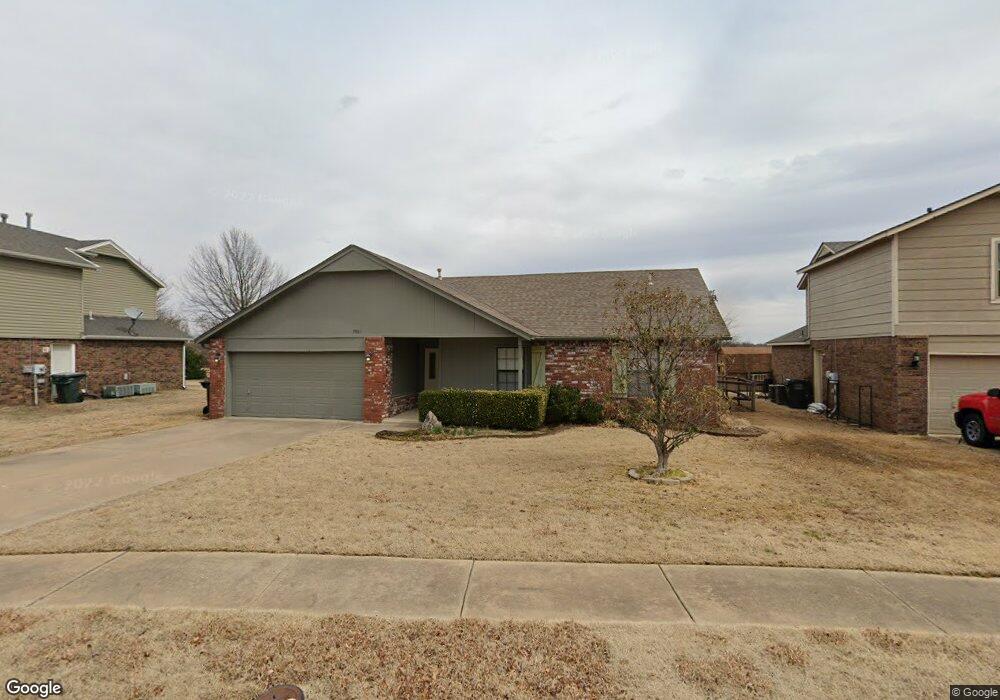
7905 N 132nd East Ave Owasso, OK 74055
Estimated Value: $222,213 - $240,000
3
Beds
2
Baths
1,419
Sq Ft
$164/Sq Ft
Est. Value
About This Home
This home is located at 7905 N 132nd East Ave, Owasso, OK 74055 and is currently estimated at $232,803, approximately $164 per square foot. 7905 N 132nd East Ave is a home located in Tulsa County with nearby schools including Mills Elementary School, Owasso 6th Grade Center, and Owasso 8th Grade Center.
Ownership History
Date
Name
Owned For
Owner Type
Purchase Details
Closed on
Jul 30, 2010
Sold by
Johnson Johnathan Brian
Bought by
Ashley Amber Wind
Current Estimated Value
Purchase Details
Closed on
Apr 8, 2010
Sold by
Stogner Dwight
Bought by
Ashley Amber Wind
Home Financials for this Owner
Home Financials are based on the most recent Mortgage that was taken out on this home.
Original Mortgage
$120,280
Interest Rate
5.02%
Mortgage Type
FHA
Purchase Details
Closed on
Jul 30, 1999
Sold by
Miller Tim F and Miller Patricia D
Bought by
Stogner Dwight
Home Financials for this Owner
Home Financials are based on the most recent Mortgage that was taken out on this home.
Original Mortgage
$87,850
Interest Rate
7.63%
Mortgage Type
Purchase Money Mortgage
Purchase Details
Closed on
Oct 1, 1989
Purchase Details
Closed on
Jun 1, 1989
Create a Home Valuation Report for This Property
The Home Valuation Report is an in-depth analysis detailing your home's value as well as a comparison with similar homes in the area
Home Values in the Area
Average Home Value in this Area
Purchase History
| Date | Buyer | Sale Price | Title Company |
|---|---|---|---|
| Ashley Amber Wind | -- | None Available | |
| Ashley Amber Wind | $122,500 | Tulsa Abstract & Title Co | |
| Stogner Dwight | $92,500 | First American Title & Abs C | |
| -- | $62,500 | -- | |
| -- | $13,000 | -- |
Source: Public Records
Mortgage History
| Date | Status | Borrower | Loan Amount |
|---|---|---|---|
| Previous Owner | Ashley Amber Wind | $120,280 | |
| Previous Owner | Stogner Dwight | $87,850 |
Source: Public Records
Tax History Compared to Growth
Tax History
| Year | Tax Paid | Tax Assessment Tax Assessment Total Assessment is a certain percentage of the fair market value that is determined by local assessors to be the total taxable value of land and additions on the property. | Land | Improvement |
|---|---|---|---|---|
| 2024 | $1,578 | $15,225 | $1,750 | $13,475 |
| 2023 | $1,578 | $14,500 | $1,663 | $12,837 |
| 2022 | $1,570 | $13,810 | $2,530 | $11,280 |
| 2021 | $1,554 | $13,810 | $2,530 | $11,280 |
| 2020 | $1,554 | $13,810 | $2,530 | $11,280 |
| 2019 | $1,547 | $13,810 | $2,530 | $11,280 |
| 2018 | $1,499 | $13,810 | $2,530 | $11,280 |
| 2017 | $1,467 | $13,475 | $2,530 | $10,945 |
| 2016 | $1,472 | $13,475 | $2,530 | $10,945 |
| 2015 | $1,483 | $13,475 | $2,530 | $10,945 |
| 2014 | $1,497 | $13,475 | $2,530 | $10,945 |
Source: Public Records
Map
Nearby Homes
- 13109 E 79th Ct N
- 7841 N 134th East Ave
- 13111 E 80th St N
- 9930 N Garnett
- 13026 E 77th Ct N
- 8001 N 128th East Ave
- 7902 N 125th East Ave
- 13135 E 76th St N
- 12700 E 82nd St N
- 7515 N 134th East Ave
- 7529 N 129th East Ave
- 7602 N 127th East Ave
- 7492 N 133rd East Ave
- 12207 E 82nd Place N
- 7607 N 122nd East Ave
- 8304 N 124th Ave E
- 8018 N 144th Ave E
- 8214 N 122nd East Ave
- 12105 E 76th Place N
- 7918 N 145th Ct E
- 7907 N 132nd East Ave
- 7901 N 132nd East Ave
- 7911 N 132nd East Ave
- 7902 N 132nd East Ave
- 7906 N 132nd East Ave
- 7828 N 132nd Ave E
- 7823 N 132nd East Ave
- 7828 N 132nd East Ave
- 13173 E 80th St N
- 7822 N 132nd East Ave
- 13164 E 80th St N
- 13169 E 80th St N
- 7819 N 132nd East Ave
- 13137 E 79th Ct N
- 13163 E 80th St N
- 13138 E 79th Ct N
- 7816 N 132nd Ave E
- 13152 E 80th St N
- 13133 E 79th Ct N
- 13157 E 80th St N