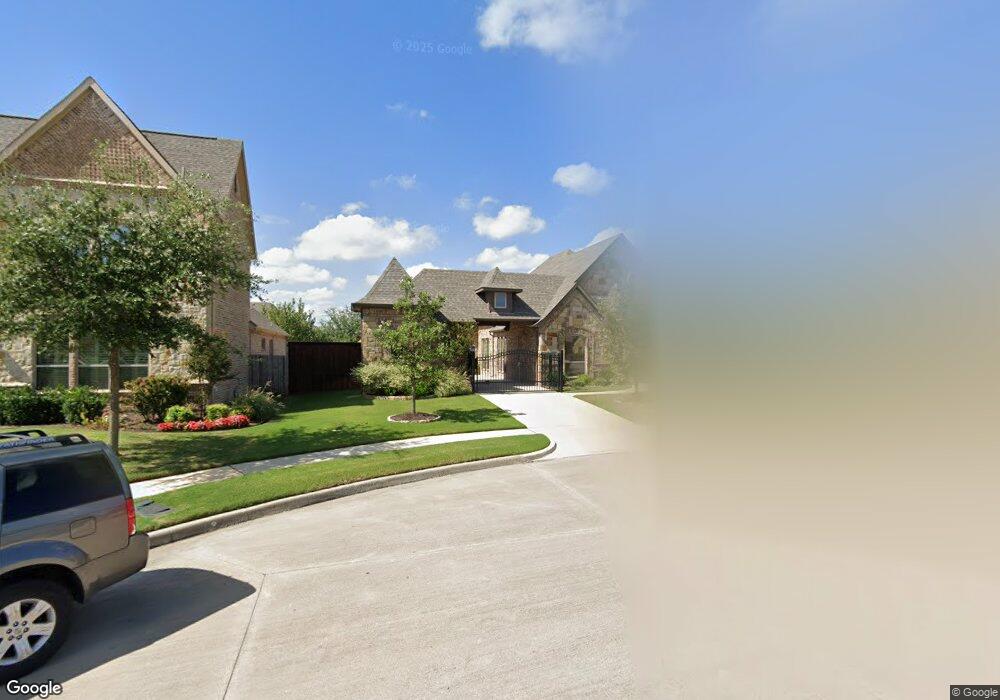
7905 Vale Ct North Richland Hills, TX 76182
Estimated Value: $683,105 - $746,000
4
Beds
3
Baths
2,766
Sq Ft
$259/Sq Ft
Est. Value
About This Home
This home is located at 7905 Vale Ct, North Richland Hills, TX 76182 and is currently estimated at $715,276, approximately $258 per square foot. 7905 Vale Ct is a home with nearby schools including W.A. Porter Elementary School, Smithfield Middle School, and Birdville High School.
Ownership History
Date
Name
Owned For
Owner Type
Purchase Details
Closed on
Aug 2, 2013
Sold by
Homes By Ashley Inc
Bought by
Timothy Enoch S and Timothy Dorothy L
Current Estimated Value
Home Financials for this Owner
Home Financials are based on the most recent Mortgage that was taken out on this home.
Original Mortgage
$408,500
Outstanding Balance
$298,123
Interest Rate
3.93%
Mortgage Type
New Conventional
Estimated Equity
$417,153
Create a Home Valuation Report for This Property
The Home Valuation Report is an in-depth analysis detailing your home's value as well as a comparison with similar homes in the area
Home Values in the Area
Average Home Value in this Area
Purchase History
| Date | Buyer | Sale Price | Title Company |
|---|---|---|---|
| Timothy Enoch S | -- | None Available |
Source: Public Records
Mortgage History
| Date | Status | Borrower | Loan Amount |
|---|---|---|---|
| Open | Timothy Enoch S | $408,500 |
Source: Public Records
Tax History Compared to Growth
Tax History
| Year | Tax Paid | Tax Assessment Tax Assessment Total Assessment is a certain percentage of the fair market value that is determined by local assessors to be the total taxable value of land and additions on the property. | Land | Improvement |
|---|---|---|---|---|
| 2025 | $5,443 | $664,220 | $130,050 | $534,170 |
| 2024 | $5,443 | $664,220 | $130,050 | $534,170 |
| 2023 | $12,550 | $675,849 | $130,050 | $545,799 |
| 2022 | $12,515 | $587,907 | $130,050 | $457,857 |
| 2021 | $12,031 | $472,804 | $100,000 | $372,804 |
| 2020 | $12,073 | $474,487 | $100,000 | $374,487 |
| 2019 | $12,144 | $461,169 | $85,000 | $376,169 |
| 2018 | $8,086 | $456,135 | $85,000 | $371,135 |
| 2017 | $11,157 | $461,083 | $100,000 | $361,083 |
| 2016 | $10,143 | $376,971 | $100,000 | $276,971 |
| 2015 | $8,075 | $381,600 | $60,000 | $321,600 |
| 2014 | $8,075 | $381,600 | $60,000 | $321,600 |
Source: Public Records
Map
Nearby Homes
- 7908 Hallmark Dr
- 7905 Hallmark Dr
- 8113 Biscayne Ct
- 8205 Edgemont Ct
- 9216 Cachelle Ct
- 8932 Thornberry Dr
- 5918 Crescent Ln
- 5903 Crescent Ln
- 9216 Hailey Ct
- 8200 Thornhill Dr
- 6112 Emmas Ct
- 5509 Texas Trail
- Bolsins Plan at Adkins Park
- Bellhaven Plan at Adkins Park
- 3404 Osprey Dr
- Grady Plan at Adkins Park
- 701 Corsair Ct
- Hillman Plan at Adkins Park
- Kenney Plan at Adkins Park
- Neece Plan at Adkins Park
- 7901 Vale Ct
- 7908 Bentley Dr
- 7900 Bentley Dr
- 7908 Vale Ct
- 9108 Belshire Dr
- 7900 Vale Ct
- 7904 Vale Ct
- 9104 Belshire Dr
- 9116 Belshire Dr
- 9100 Belshire Dr
- 7905 Bentley Dr
- 7909 Bentley Dr
- 126 Oak Leaf Dr
- 7901 Bentley Dr
- 9120 Belshire Dr
- 9109 Glendara Dr
- 9020 Belshire Dr
- 9124 Belshire Dr
- 9113 Glendara Dr
- 9105 Glendara Dr