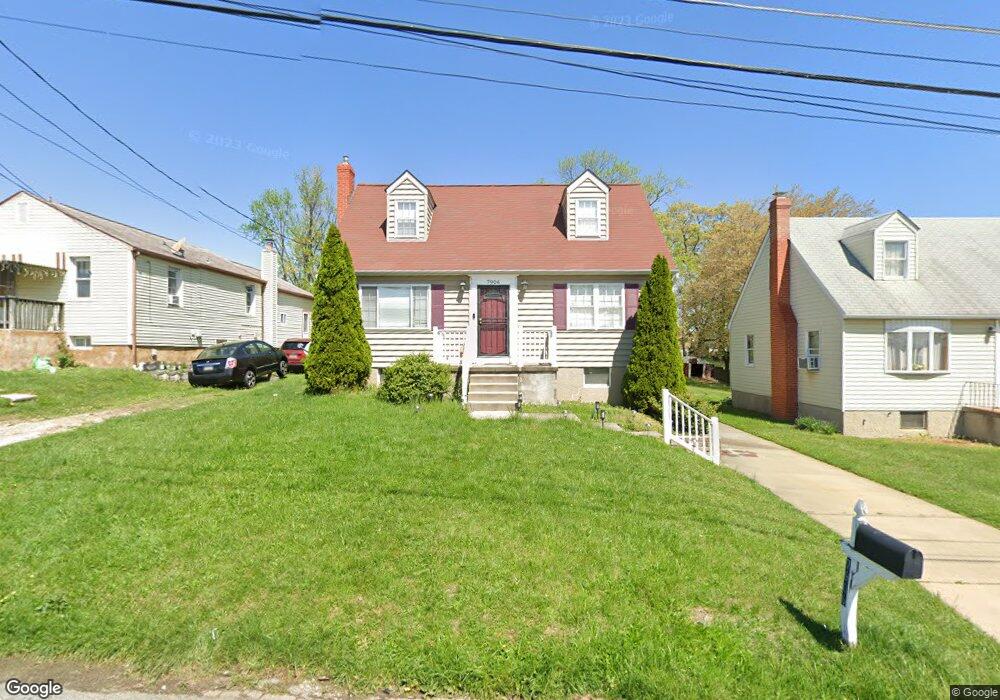
7906 34th St Rosedale, MD 21237
Estimated Value: $285,000 - $374,000
4
Beds
3
Baths
1,188
Sq Ft
$270/Sq Ft
Est. Value
About This Home
This home is located at 7906 34th St, Rosedale, MD 21237 and is currently estimated at $320,224, approximately $269 per square foot. 7906 34th St is a home located in Baltimore County with nearby schools including Red House Run Elementary School, Golden Ring Middle School, and Overlea High School.
Ownership History
Date
Name
Owned For
Owner Type
Purchase Details
Closed on
Jun 9, 2017
Sold by
Omo Osagie Kasarachi P and Omo Osagie Patrick N
Bought by
Omo Osagie Kasarachi P
Current Estimated Value
Home Financials for this Owner
Home Financials are based on the most recent Mortgage that was taken out on this home.
Original Mortgage
$209,859
Outstanding Balance
$173,253
Interest Rate
3.75%
Mortgage Type
FHA
Estimated Equity
$146,971
Purchase Details
Closed on
Jul 13, 2009
Sold by
Mathews Dennis L
Bought by
Ono-Osagie Kasarchi P and Omo-Osagie Patrick N
Purchase Details
Closed on
Nov 19, 2008
Sold by
Bank Of New York
Bought by
Mathews Dennis L
Purchase Details
Closed on
Oct 20, 2008
Sold by
Bank Of New York
Bought by
Mathews Dennis L
Purchase Details
Closed on
Feb 20, 2008
Sold by
Hoffer Roy
Bought by
Bank Of New York
Purchase Details
Closed on
Feb 11, 2008
Sold by
Hoffer Roy
Bought by
Bank Of New York
Create a Home Valuation Report for This Property
The Home Valuation Report is an in-depth analysis detailing your home's value as well as a comparison with similar homes in the area
Home Values in the Area
Average Home Value in this Area
Purchase History
| Date | Buyer | Sale Price | Title Company |
|---|---|---|---|
| Omo Osagie Kasarachi P | -- | National Link | |
| Ono-Osagie Kasarchi P | $245,000 | -- | |
| Mathews Dennis L | $84,000 | -- | |
| Mathews Dennis L | $84,000 | -- | |
| Bank Of New York | $190,000 | -- | |
| Bank Of New York | $190,000 | -- |
Source: Public Records
Mortgage History
| Date | Status | Borrower | Loan Amount |
|---|---|---|---|
| Open | Omo Osagie Kasarachi P | $209,859 |
Source: Public Records
Tax History
| Year | Tax Paid | Tax Assessment Tax Assessment Total Assessment is a certain percentage of the fair market value that is determined by local assessors to be the total taxable value of land and additions on the property. | Land | Improvement |
|---|---|---|---|---|
| 2025 | $3,156 | $194,167 | -- | -- |
| 2024 | $3,156 | $179,033 | $0 | $0 |
| 2023 | $1,406 | $163,900 | $71,300 | $92,600 |
| 2022 | $2,774 | $159,333 | $0 | $0 |
| 2021 | $2,667 | $154,767 | $0 | $0 |
| 2020 | $2,667 | $150,200 | $71,300 | $78,900 |
| 2019 | $2,478 | $144,100 | $0 | $0 |
| 2018 | $2,559 | $138,000 | $0 | $0 |
| 2017 | $2,476 | $131,900 | $0 | $0 |
| 2016 | $2,412 | $128,567 | $0 | $0 |
| 2015 | $2,412 | $125,233 | $0 | $0 |
| 2014 | $2,412 | $121,900 | $0 | $0 |
Source: Public Records
Map
Nearby Homes
- 5900 Hamilton Ave
- 1619 Rosewick Ave
- 1704 Chesaco Ave
- 7908 Underhill Rd
- 8013 Neighbors Ave
- 8007 Sagramore Rd
- 8110 Bartholomew Ct
- 8125 Bartholomew Ct
- 8131 Bartholomew Ct
- 8133 Bartholomew Ct
- 8120 Bartholomew Ct
- 8135 Bartholomew Ct
- 8130 Bartholomew Ct
- 8128 Bartholomew Ct
- 8126 Bartholomew Ct
- 8139 Bartholomew Ct
- 8141 Bartholomew Ct
- 8143 Bartholomew Ct
- 2308 Hamiltowne Cir
- 8145 Bartholomew Ct
Your Personal Tour Guide
Ask me questions while you tour the home.