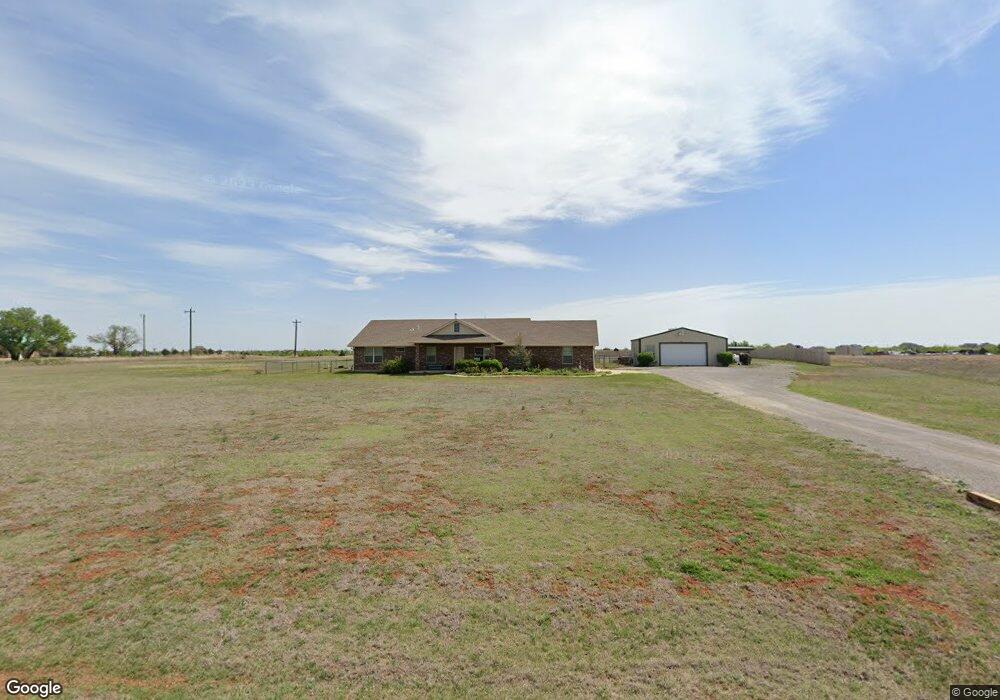
7906 Akeman Dr Piedmont, OK 73078
Estimated Value: $371,000 - $469,000
3
Beds
2
Baths
2,101
Sq Ft
$203/Sq Ft
Est. Value
About This Home
This home is located at 7906 Akeman Dr, Piedmont, OK 73078 and is currently estimated at $426,743, approximately $203 per square foot. 7906 Akeman Dr is a home located in Canadian County with nearby schools including Piedmont Elementary School, Piedmont Intermediate Elementary School, and Piedmont Middle School.
Ownership History
Date
Name
Owned For
Owner Type
Purchase Details
Closed on
Jan 6, 2025
Sold by
Guard Michael
Bought by
Guard Michael and Guard Lucas George
Current Estimated Value
Purchase Details
Closed on
Sep 22, 2008
Sold by
Brass Brick Homes Vii Llc
Bought by
Guard Michael and Guard Kathleen
Home Financials for this Owner
Home Financials are based on the most recent Mortgage that was taken out on this home.
Original Mortgage
$167,107
Interest Rate
6.57%
Mortgage Type
Credit Line Revolving
Purchase Details
Closed on
Feb 20, 2007
Sold by
Miracle Bobby and Miracle Amelia
Bought by
Hoar Stanley O and Hoar Janet
Purchase Details
Closed on
Sep 8, 2003
Sold by
Hoar Stanley B and Hoar Janet
Home Financials for this Owner
Home Financials are based on the most recent Mortgage that was taken out on this home.
Original Mortgage
$18,900
Interest Rate
6.08%
Create a Home Valuation Report for This Property
The Home Valuation Report is an in-depth analysis detailing your home's value as well as a comparison with similar homes in the area
Home Values in the Area
Average Home Value in this Area
Purchase History
| Date | Buyer | Sale Price | Title Company |
|---|---|---|---|
| Guard Michael | -- | None Listed On Document | |
| Guard Michael | $209,000 | Stewart Abstract & Title Co | |
| Hoar Stanley O | -- | None Available | |
| -- | $21,000 | -- |
Source: Public Records
Mortgage History
| Date | Status | Borrower | Loan Amount |
|---|---|---|---|
| Previous Owner | Guard Michael | $167,107 | |
| Previous Owner | -- | $18,900 |
Source: Public Records
Tax History Compared to Growth
Tax History
| Year | Tax Paid | Tax Assessment Tax Assessment Total Assessment is a certain percentage of the fair market value that is determined by local assessors to be the total taxable value of land and additions on the property. | Land | Improvement |
|---|---|---|---|---|
| 2024 | $3,449 | $32,778 | $5,180 | $27,598 |
| 2023 | $3,276 | $31,823 | $4,920 | $26,903 |
| 2022 | $3,208 | $30,896 | $4,755 | $26,141 |
| 2021 | $3,335 | $29,997 | $3,856 | $26,141 |
| 2020 | $3,400 | $30,061 | $3,856 | $26,205 |
| 2019 | $3,197 | $29,749 | $3,856 | $25,893 |
| 2018 | $3,085 | $28,333 | $3,856 | $24,477 |
| 2017 | $3,073 | $28,333 | $3,856 | $24,477 |
| 2016 | $2,885 | $27,829 | $3,856 | $23,973 |
| 2015 | $2,496 | $26,255 | $3,856 | $22,399 |
| 2014 | $2,496 | $25,066 | $3,856 | $21,210 |
Source: Public Records
Map
Nearby Homes
- 1 Akeman Dr NE
- 7432 Akeman Dr NE
- 7924 NE Eagle Dr
- 7630 Hawk Dr NE
- 7530 Hawk Dr NE
- 7631 Hawk Dr NE
- 7624 Eagle Dr NE
- 7825 NE Eagle Dr
- 7824 NE Eagle Dr
- 7431 NE Hawk Dr
- 7270 Avondale Ln NE
- 7011 Mustang Rd NE
- 9411 Dickerson Rd NE
- 9125 Mustang Rd NE
- 5200 Azalea St NE
- 8955 Falcon Dr
- 9308 Lake Dr
- 2 Sprouts Creek Rd
- 3 Waterloo
- 1 Sprouts Creek Rd
- 7860 Akeman Dr
- 2756 Moffat Rd NE
- 8044 NE Traditions
- 0 Akeman Dr NE
- 7851 Akeman Dr
- 7758 Akeman Dr
- 8106 Traditions Dr
- 8046 Wolf Lake Dr
- 8109 Traditions Dr
- 7495 Avalon Ln
- 7717 Akeman Dr
- 7722 Akeman Dr
- 8150 Carolina Ct
- 8328 Wolf Lake Dr
- 8151 Carolina Ct
- 7777 Sara Rd NE
- 3013 Moffat Rd NE
- 3013 Moffat Rd NE
- 8341 NE Wolf Lake Dr
- 000 Akeman Dr