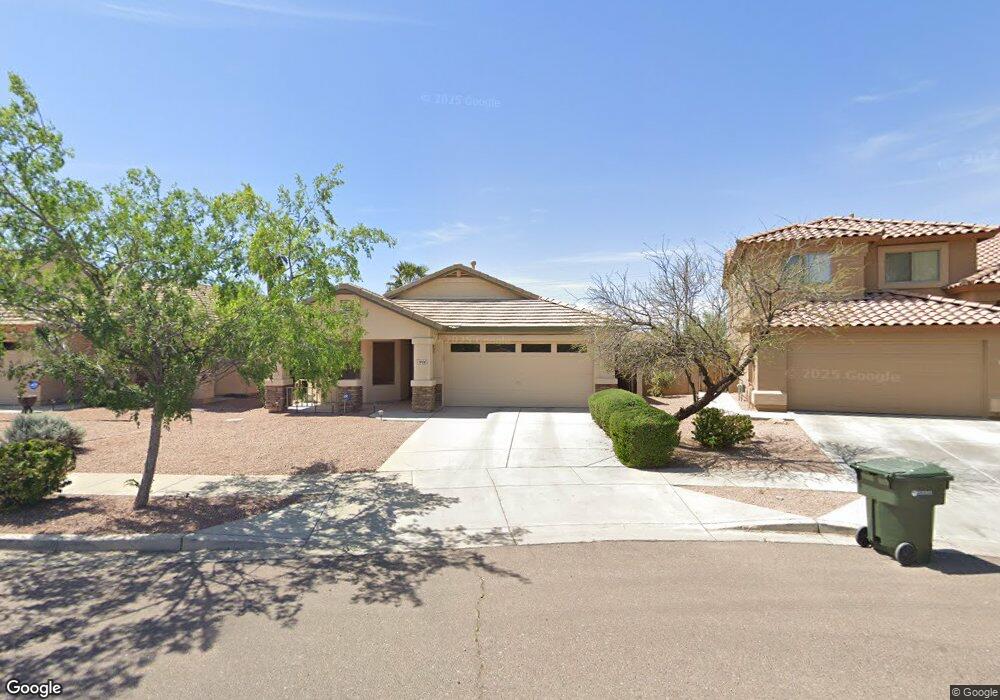
7906 S 48th Dr Laveen, AZ 85339
Laveen NeighborhoodEstimated Value: $373,277 - $399,000
3
Beds
2
Baths
1,692
Sq Ft
$229/Sq Ft
Est. Value
About This Home
This home is located at 7906 S 48th Dr, Laveen, AZ 85339 and is currently estimated at $387,069, approximately $228 per square foot. 7906 S 48th Dr is a home located in Maricopa County with nearby schools including Betty Fairfax High School, Phoenix Coding Academy, and Legacy Traditional School - Laveen Village.
Ownership History
Date
Name
Owned For
Owner Type
Purchase Details
Closed on
May 8, 2008
Sold by
Federal National Mortgage Association
Bought by
Phommachit Thavinh
Current Estimated Value
Home Financials for this Owner
Home Financials are based on the most recent Mortgage that was taken out on this home.
Original Mortgage
$148,483
Outstanding Balance
$94,034
Interest Rate
5.88%
Mortgage Type
New Conventional
Estimated Equity
$293,035
Purchase Details
Closed on
Oct 9, 2007
Sold by
Alterio Lynda B and Mortgage Electronic Registrati
Bought by
Federal National Mortgage Association
Purchase Details
Closed on
Jan 5, 2005
Sold by
Continental Homes Inc
Bought by
Alterio Lynda B
Home Financials for this Owner
Home Financials are based on the most recent Mortgage that was taken out on this home.
Original Mortgage
$165,229
Interest Rate
5.7%
Mortgage Type
New Conventional
Create a Home Valuation Report for This Property
The Home Valuation Report is an in-depth analysis detailing your home's value as well as a comparison with similar homes in the area
Home Values in the Area
Average Home Value in this Area
Purchase History
| Date | Buyer | Sale Price | Title Company |
|---|---|---|---|
| Phommachit Thavinh | $165,000 | Lawyers Title Insurance Corp | |
| Federal National Mortgage Association | $162,165 | Security Title Agency | |
| Alterio Lynda B | $173,926 | Dhi Title Of Arizona Inc | |
| Continental Homes Inc | -- | Dhi Title Of Arizona Inc |
Source: Public Records
Mortgage History
| Date | Status | Borrower | Loan Amount |
|---|---|---|---|
| Open | Phommachit Thavinh | $148,483 | |
| Previous Owner | Alterio Lynda B | $165,229 |
Source: Public Records
Tax History Compared to Growth
Tax History
| Year | Tax Paid | Tax Assessment Tax Assessment Total Assessment is a certain percentage of the fair market value that is determined by local assessors to be the total taxable value of land and additions on the property. | Land | Improvement |
|---|---|---|---|---|
| 2025 | $1,653 | $11,890 | -- | -- |
| 2024 | $1,622 | $11,324 | -- | -- |
| 2023 | $1,622 | $26,880 | $5,370 | $21,510 |
| 2022 | $1,573 | $20,450 | $4,090 | $16,360 |
| 2021 | $1,586 | $18,830 | $3,760 | $15,070 |
| 2020 | $1,543 | $17,010 | $3,400 | $13,610 |
| 2019 | $1,548 | $15,350 | $3,070 | $12,280 |
| 2018 | $1,472 | $13,900 | $2,780 | $11,120 |
| 2017 | $1,392 | $12,270 | $2,450 | $9,820 |
| 2016 | $1,321 | $11,250 | $2,250 | $9,000 |
| 2015 | $1,190 | $10,660 | $2,130 | $8,530 |
Source: Public Records
Map
Nearby Homes
- 4730 W Fawn Dr
- 4803 W Beautiful Ln
- 4939 W Harwell Rd
- 4933 W Melody Ln
- 4605 W Beverly Rd Unit 2
- 6951 W Pedro Ln
- 6838 W Pedro Ln
- 4539 W Beautiful Ln
- 8213 S Jenna Ln
- 8222 S Jenna Ln
- 4812 W Dunbar Dr
- 4830 W Ardmore Rd
- 7336 S 48th Glen
- 8431 S 50th Dr
- 5124 W Fawn Dr
- 4745 W Fremont Rd
- 8616 S 46th Ln
- 4726 W Fremont Rd
- 7503 S 45th Dr
- 4501 W Carter Rd Unit 8
- 7910 S 48th Dr
- 7902 S 48th Dr
- 7914 S 48th Dr Unit 1
- 7915 S 48th Ln
- 7919 S 48th Ln
- 7911 S 48th Ln
- 7918 S 48th Dr
- 4824 W Harwell Rd
- 7907 S 48th Ln
- 7907 S 48th Dr
- 4820 W Harwell Rd
- 7911 S 48th Dr
- 7922 S 48th Dr
- 7823 S 48th Ln
- 7915 S 48th Dr Unit 1
- 4816 W Harwell Rd
- 8004 S 48th Dr
- 7919 S 48th Dr
- 4825 W Fawn Dr
- 4829 W Fawn Dr