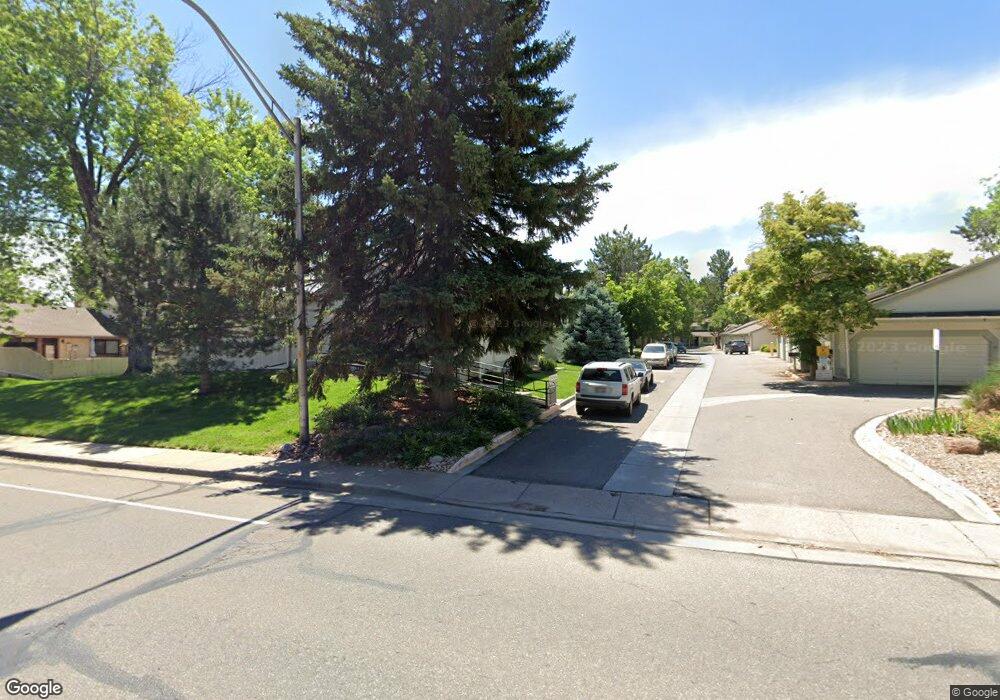
7906 W 90th Ave Unit 83 Westminster, CO 80021
Kings Mill NeighborhoodEstimated Value: $322,431 - $380,000
2
Beds
1
Bath
912
Sq Ft
$374/Sq Ft
Est. Value
About This Home
This home is located at 7906 W 90th Ave Unit 83, Westminster, CO 80021 and is currently estimated at $341,108, approximately $374 per square foot. 7906 W 90th Ave Unit 83 is a home located in Jefferson County with nearby schools including Weber Elementary School, Moore Middle School, and Pomona High School.
Ownership History
Date
Name
Owned For
Owner Type
Purchase Details
Closed on
Dec 14, 2011
Sold by
Gibbons Roger W and Gibbons Katherine A
Bought by
Roger W Gibbons & Katherine A Gibbons Re
Current Estimated Value
Purchase Details
Closed on
Sep 27, 2000
Sold by
Humenick Christine L
Bought by
Keenan Rick
Purchase Details
Closed on
Sep 26, 2000
Sold by
Keenan Rick
Bought by
Gibbons Roger W and Gibbons Katherine A
Purchase Details
Closed on
Aug 14, 1998
Sold by
Garcia Roman R and Garcia Mary L
Bought by
Humenick Christine L
Home Financials for this Owner
Home Financials are based on the most recent Mortgage that was taken out on this home.
Original Mortgage
$102,117
Interest Rate
6.9%
Mortgage Type
FHA
Purchase Details
Closed on
Jan 21, 1994
Sold by
Garcia Roman R
Bought by
Garcia Roman R and Garcia Mary L
Home Financials for this Owner
Home Financials are based on the most recent Mortgage that was taken out on this home.
Original Mortgage
$52,500
Interest Rate
7.16%
Create a Home Valuation Report for This Property
The Home Valuation Report is an in-depth analysis detailing your home's value as well as a comparison with similar homes in the area
Home Values in the Area
Average Home Value in this Area
Purchase History
| Date | Buyer | Sale Price | Title Company |
|---|---|---|---|
| Roger W Gibbons & Katherine A Gibbons Re | -- | None Available | |
| Keenan Rick | $125,000 | -- | |
| Gibbons Roger W | -- | -- | |
| Humenick Christine L | $103,000 | -- | |
| Garcia Roman R | -- | Land Title |
Source: Public Records
Mortgage History
| Date | Status | Borrower | Loan Amount |
|---|---|---|---|
| Previous Owner | Humenick Christine L | $102,117 | |
| Previous Owner | Garcia Roman R | $52,500 |
Source: Public Records
Tax History Compared to Growth
Tax History
| Year | Tax Paid | Tax Assessment Tax Assessment Total Assessment is a certain percentage of the fair market value that is determined by local assessors to be the total taxable value of land and additions on the property. | Land | Improvement |
|---|---|---|---|---|
| 2024 | $1,465 | $19,234 | $6,030 | $13,204 |
| 2023 | $1,465 | $19,234 | $6,030 | $13,204 |
| 2022 | $1,397 | $17,971 | $4,170 | $13,801 |
| 2021 | $1,418 | $18,488 | $4,290 | $14,198 |
| 2020 | $1,152 | $15,104 | $4,290 | $10,814 |
| 2019 | $1,134 | $15,104 | $4,290 | $10,814 |
| 2018 | $1,081 | $13,922 | $3,600 | $10,322 |
| 2017 | $968 | $13,922 | $3,600 | $10,322 |
| 2016 | $834 | $11,136 | $2,866 | $8,270 |
| 2015 | $714 | $11,136 | $2,866 | $8,270 |
| 2014 | $714 | $8,884 | $2,229 | $6,655 |
Source: Public Records
Map
Nearby Homes
- 9026 Ammons Ct
- 7810 W 90th Ave Unit 57
- 7810 W 90th Dr
- 8357 W 90th Place Unit 1703
- 8790 Allison Dr Unit D
- 8762 Allison Dr Unit A
- 8346 W 87th Dr Unit D
- 8783 Allison Dr Unit D
- 8750 Allison Dr Unit D
- 7721 W 87th Dr
- 14551 W 91st Ln Unit A
- 7740 W 87th Dr Unit C
- 7720 W 87th Dr Unit C
- 7720 W 87th Dr Unit N
- 7780 W 87th Dr Unit E
- 8696 W 86th Cir
- 7790 W 87th Dr Unit D
- 8695 Yukon St Unit O
- 7870 W 87th Dr Unit J
- 9251 Wadsworth Blvd
- 7904 W 90th Ave Unit 82
- 7902 W 90th Ave Unit 81
- 7900 W 90th Ave Unit 80
- 7908 W 90th Ave Unit 84
- 7848 W 90th Ave Unit 76
- 7850 W 90th Ave Unit 77
- 7852 W 90th Ave Unit 78
- 7854 W 90th Ave Unit 79
- 7846 W 90th Ave Unit 75
- 7910 W 90th Ave Unit 85
- 7844 W 90th Ave Unit 74
- 7842 W 90th Ave Unit 73
- 7960 W 90th Ave Unit 110
- 7912 W 90th Ave Unit 86
- 7840 W 90th Ave Unit 72
- 7962 W 90th Ave Unit 111
- 7838 W 90th Ave Unit 71
- 7968 W 90th Ave Unit 114
- 7966 W 90th Ave Unit 113
- 7914 W 90th Ave Unit 87