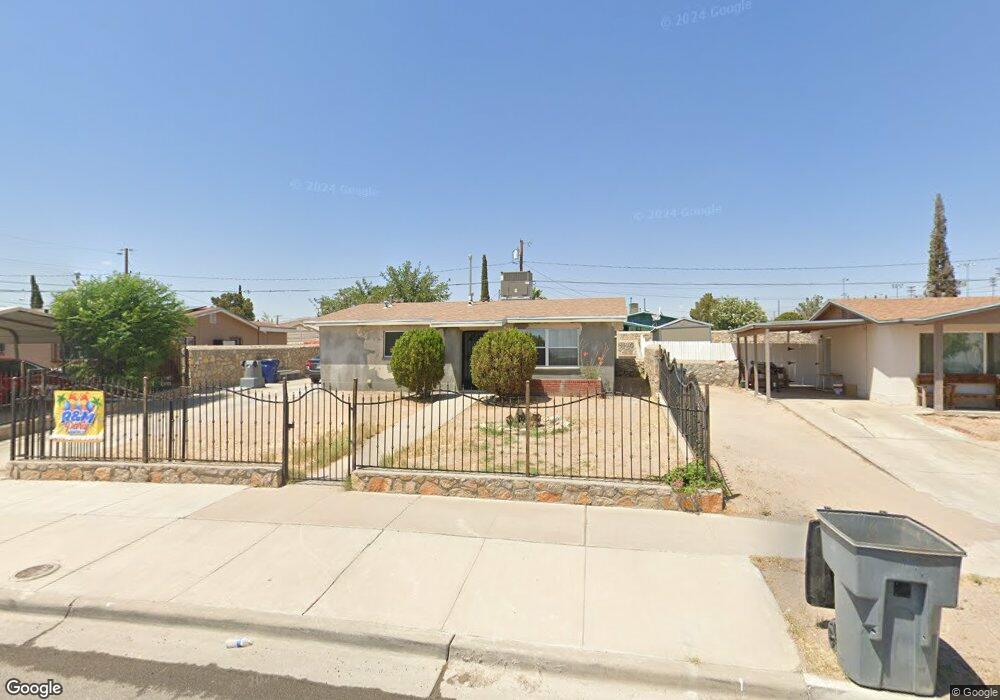
7907 San Paulo Dr El Paso, TX 79915
Sageland NeighborhoodEstimated Value: $136,000 - $155,000
--
Bed
1
Bath
910
Sq Ft
$159/Sq Ft
Est. Value
About This Home
This home is located at 7907 San Paulo Dr, El Paso, TX 79915 and is currently estimated at $145,059, approximately $159 per square foot. 7907 San Paulo Dr is a home located in El Paso County with nearby schools including Sageland Elementary School, Bel Air Middle, and Bel Air High School.
Ownership History
Date
Name
Owned For
Owner Type
Purchase Details
Closed on
Jun 5, 2021
Sold by
Carrasco Rocio Elizabeth and Estate Of Ruben Carrasco
Bought by
Torres Elva J and Carrasco Sandra Catalina
Current Estimated Value
Purchase Details
Closed on
Mar 10, 2015
Sold by
Carrazco Nancy and Luna Nancy C
Bought by
Carrasco Ruben
Home Financials for this Owner
Home Financials are based on the most recent Mortgage that was taken out on this home.
Original Mortgage
$113,250
Interest Rate
3.56%
Mortgage Type
Reverse Mortgage Home Equity Conversion Mortgage
Purchase Details
Closed on
May 13, 2013
Sold by
Camacho Jordan Elsa Alicia
Bought by
Camacho Jesus Manuel
Purchase Details
Closed on
Jan 9, 2002
Sold by
Carrasco Ruben M
Bought by
Luna Nancy C
Home Financials for this Owner
Home Financials are based on the most recent Mortgage that was taken out on this home.
Original Mortgage
$45,600
Interest Rate
7.07%
Mortgage Type
Credit Line Revolving
Create a Home Valuation Report for This Property
The Home Valuation Report is an in-depth analysis detailing your home's value as well as a comparison with similar homes in the area
Home Values in the Area
Average Home Value in this Area
Purchase History
| Date | Buyer | Sale Price | Title Company |
|---|---|---|---|
| Torres Elva J | -- | None Available | |
| Torres Elva J | -- | None Available | |
| Carrasco Ruben | -- | Capital Title | |
| Camacho Jesus Manuel | -- | Falvey Victor H | |
| Luna Nancy C | -- | -- |
Source: Public Records
Mortgage History
| Date | Status | Borrower | Loan Amount |
|---|---|---|---|
| Previous Owner | Carrasco Ruben | $113,250 | |
| Previous Owner | Luna Nancy C | $45,600 |
Source: Public Records
Tax History Compared to Growth
Tax History
| Year | Tax Paid | Tax Assessment Tax Assessment Total Assessment is a certain percentage of the fair market value that is determined by local assessors to be the total taxable value of land and additions on the property. | Land | Improvement |
|---|---|---|---|---|
| 2025 | $1,186 | $120,907 | -- | -- |
| 2024 | $1,186 | $109,915 | $17,679 | $92,236 |
| 2023 | $1,154 | $102,436 | $17,679 | $84,757 |
| 2022 | $2,991 | $96,310 | $17,679 | $78,631 |
| 2021 | $2,574 | $79,175 | $17,679 | $61,496 |
| 2020 | $2,308 | $73,071 | $12,522 | $60,549 |
| 2018 | $2,303 | $74,061 | $12,522 | $61,539 |
| 2017 | $2,101 | $68,745 | $12,522 | $56,223 |
| 2016 | $2,101 | $68,745 | $12,522 | $56,223 |
| 2015 | $706 | $68,745 | $12,522 | $56,223 |
| 2014 | $706 | $68,741 | $12,522 | $56,219 |
Source: Public Records
Map
Nearby Homes
- 7928 Hermosillo Dr
- 7937 San Paulo Dr
- 7800 Hermosillo Dr
- 812 Santa Barbara Dr
- 844 Santa Barbara Dr
- 7922 Parral Dr
- 7975 Esther Rd
- 740 Draco Place
- 7832 Ranchland Dr
- 7718 Parral Dr
- 8004 Gilbert Dr
- 7655 Hacienda Ave
- 7713 Matamoros Dr
- 537 Emerson St
- 7921 Lirio Rd
- 7909 La Jolla Dr
- 7761 Maverick Ave
- 7622 Matamoros Dr
- 7542 Hermosillo Dr
- 1121 Stanley St
- 7905 San Paulo Dr
- 7909 San Paulo Dr
- 7906 Monterrey Dr
- 7908 Monterrey Dr
- 7903 San Paulo Dr
- 7904 Monterrey Dr
- 7910 Monterrey Dr
- 625 Venado Dr
- 7902 Monterrey Dr
- 7901 San Paulo Dr
- 7911 San Paulo Dr
- 626 La Paz Dr
- 7900 Monterrey Dr
- 623 Venado Dr
- 7916 Monterrey Dr
- 624 La Paz Dr
- 7913 San Paulo Dr
- 7910 San Paulo Dr
- 7911 Monterrey Dr
- 7909 Monterrey Dr