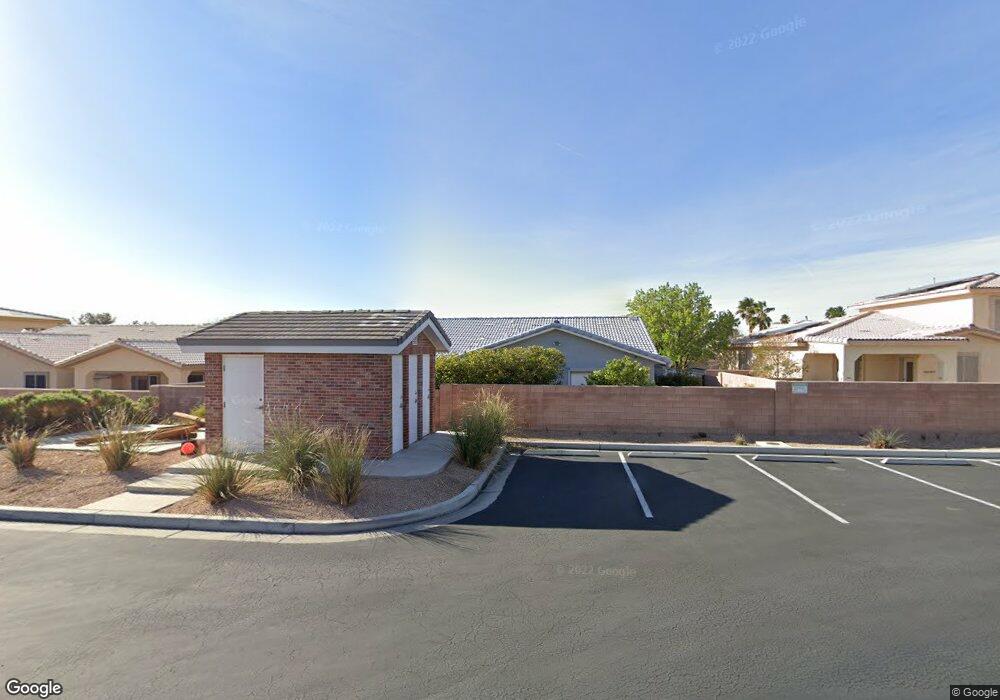
7908 Canley Ave Unit 2 Las Vegas, NV 89149
Estimated Value: $536,000 - $561,688
3
Beds
2
Baths
2,238
Sq Ft
$246/Sq Ft
Est. Value
About This Home
This home is located at 7908 Canley Ave Unit 2, Las Vegas, NV 89149 and is currently estimated at $551,172, approximately $246 per square foot. 7908 Canley Ave Unit 2 is a home located in Clark County with nearby schools including Dean Lamar Allen Elementary School, Edmundo "Eddie" Escobedo, Sr. Middle School, and Centennial High School.
Ownership History
Date
Name
Owned For
Owner Type
Purchase Details
Closed on
Jun 22, 2023
Sold by
Miller Family Trust
Bought by
Miller Patricia S
Current Estimated Value
Purchase Details
Closed on
May 30, 2003
Sold by
Miller Jack R and Miller Marilyn G
Bought by
Miller Jack R and Miller Marilyn G
Purchase Details
Closed on
Oct 16, 2002
Sold by
Bank Of New York
Bought by
Miller Jack R and Miller Marilyn G
Home Financials for this Owner
Home Financials are based on the most recent Mortgage that was taken out on this home.
Original Mortgage
$171,200
Interest Rate
6.05%
Purchase Details
Closed on
Aug 16, 2002
Sold by
Grayson Thomas R and Morgan Esther M
Bought by
Bank Of New York
Purchase Details
Closed on
Mar 29, 2000
Sold by
Baines Richard A
Bought by
Grayson Thomas R and Morgan Esther M
Home Financials for this Owner
Home Financials are based on the most recent Mortgage that was taken out on this home.
Original Mortgage
$216,225
Interest Rate
10.25%
Create a Home Valuation Report for This Property
The Home Valuation Report is an in-depth analysis detailing your home's value as well as a comparison with similar homes in the area
Home Values in the Area
Average Home Value in this Area
Purchase History
| Date | Buyer | Sale Price | Title Company |
|---|---|---|---|
| Miller Patricia S | -- | None Listed On Document | |
| Patricia Miller Living Trust | -- | None Listed On Document | |
| Miller Jack R | -- | -- | |
| Miller Jack R | $214,000 | Fidelity National Title | |
| Bank Of New York | $207,000 | Fidelity National Title | |
| Grayson Thomas R | $240,250 | Land Title |
Source: Public Records
Mortgage History
| Date | Status | Borrower | Loan Amount |
|---|---|---|---|
| Previous Owner | Miller Jack R | $171,200 | |
| Previous Owner | Grayson Thomas R | $216,225 | |
| Closed | Grayson Thomas R | $12,012 | |
| Closed | Miller Jack R | $21,400 |
Source: Public Records
Tax History Compared to Growth
Tax History
| Year | Tax Paid | Tax Assessment Tax Assessment Total Assessment is a certain percentage of the fair market value that is determined by local assessors to be the total taxable value of land and additions on the property. | Land | Improvement |
|---|---|---|---|---|
| 2025 | $2,713 | $137,705 | $42,000 | $95,705 |
| 2024 | $2,635 | $137,705 | $42,000 | $95,705 |
| 2023 | $2,635 | $136,090 | $45,500 | $90,590 |
| 2022 | $2,558 | $120,466 | $37,450 | $83,016 |
| 2021 | $2,484 | $110,356 | $31,500 | $78,856 |
| 2020 | $2,409 | $108,220 | $30,100 | $78,120 |
| 2019 | $2,338 | $103,157 | $26,250 | $76,907 |
| 2018 | $2,270 | $97,419 | $23,100 | $74,319 |
| 2017 | $3,174 | $96,627 | $21,350 | $75,277 |
| 2016 | $2,150 | $79,978 | $17,150 | $62,828 |
| 2015 | $2,145 | $63,316 | $13,650 | $49,666 |
| 2014 | $2,083 | $67,265 | $10,500 | $56,765 |
Source: Public Records
Map
Nearby Homes
- 5704 Burdel St
- 7837 Mission Point Ln
- 5721 Whale Rock St
- 5712 Savant Ct
- 7844 Quill Gordon Ave
- 5728 Savant Ct
- 7804 Wind Drift Rd
- 7908 Painted Rock Ln
- 7912 Painted Rock Ln
- 7849 March Brown Ave
- 5708 Berwick Falls Ln
- 7721 Beach Falls Ct
- 5509 Big Sky Ln
- 5508 Big Sky Ln
- 5600 Bolton Bay Way
- 7772 Buckwood Ct
- 5604 Windy Gorge St
- 5732 Desert Sky Way
- 5421 Painted Sunrise Dr
- 5416 Irish Spring St
- 7912 Canley Ave
- 7904 Canley Ave
- 7916 Canley Ave
- 7900 Canley Ave Unit 2
- 7910 Kiowa Cir
- 5700 Burdel St
- 7900 Kiowa Cir
- 7920 Canley Ave
- 5624 Burdel St
- 5709 Burdel St
- 5705 Burdel St
- 7909 Kiowa Cir
- 5701 Burdel St
- 5713 Ocean Beach Dr Unit 1
- 5709 Ocean Beach Dr
- 5717 Ocean Beach Dr
- 5620 Burdel St
- 5705 Ocean Beach Dr
- 5701 Ocean Beach Dr
- 5721 Ocean Beach Dr