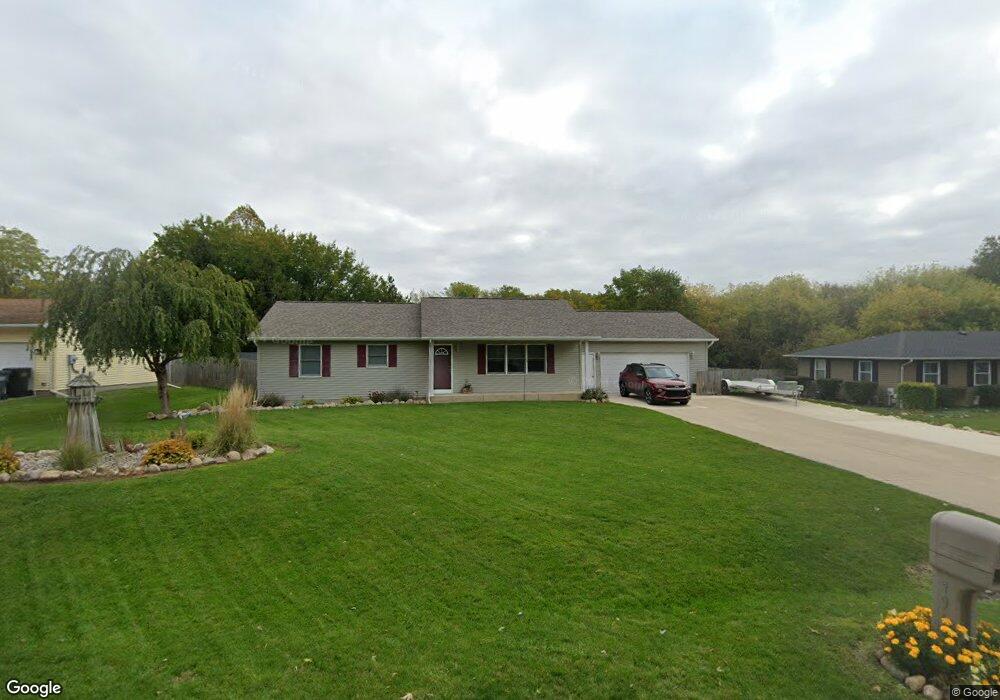
791 Autumn Dr Otsego, MI 49078
Estimated Value: $231,983 - $294,000
3
Beds
2
Baths
1,344
Sq Ft
$199/Sq Ft
Est. Value
About This Home
This home is located at 791 Autumn Dr, Otsego, MI 49078 and is currently estimated at $267,496, approximately $199 per square foot. 791 Autumn Dr is a home with nearby schools including Plainwell High School.
Ownership History
Date
Name
Owned For
Owner Type
Purchase Details
Closed on
Jul 11, 1999
Sold by
Termeer Robert
Bought by
Pomeroy Daniel and Pomeroy Marcia
Current Estimated Value
Purchase Details
Closed on
Jun 9, 1999
Sold by
Termeer Robert
Bought by
Pomeroy Daniel and Pomeroy Marcia L
Purchase Details
Closed on
Mar 12, 1998
Sold by
Dussia Phillip E and Bernice T
Bought by
Termeer Robert
Purchase Details
Closed on
Jul 17, 1996
Sold by
Kantz Stephen M and Kantz Sandra K
Bought by
Dussia Phillip and Dussia Bernice
Purchase Details
Closed on
Jul 1, 1996
Sold by
Kantz Stephen M and Kantz Sandra
Bought by
Dussia Phillip E and Dussia Bernice T
Purchase Details
Closed on
May 8, 1995
Sold by
Daleidan John -Scott George
Bought by
Kantz Stephen and Kantz Sandra
Create a Home Valuation Report for This Property
The Home Valuation Report is an in-depth analysis detailing your home's value as well as a comparison with similar homes in the area
Home Values in the Area
Average Home Value in this Area
Purchase History
| Date | Buyer | Sale Price | Title Company |
|---|---|---|---|
| Pomeroy Daniel | $113,900 | -- | |
| Pomeroy Daniel | $113,900 | -- | |
| Termeer Robert | $15,000 | -- | |
| Dussia Phillip | $10,200 | -- | |
| Dussia Phillip E | $10,200 | -- | |
| Kantz Stephen | $10,200 | -- |
Source: Public Records
Tax History Compared to Growth
Tax History
| Year | Tax Paid | Tax Assessment Tax Assessment Total Assessment is a certain percentage of the fair market value that is determined by local assessors to be the total taxable value of land and additions on the property. | Land | Improvement |
|---|---|---|---|---|
| 2025 | $2,493 | $92,800 | $9,500 | $83,300 |
| 2024 | $2,273 | $88,600 | $9,100 | $79,500 |
| 2023 | $2,309 | $82,600 | $9,000 | $73,600 |
| 2022 | $2,273 | $74,200 | $8,000 | $66,200 |
| 2021 | $2,123 | $78,800 | $8,000 | $70,800 |
| 2020 | $2,123 | $79,500 | $8,000 | $71,500 |
| 2019 | $0 | $77,600 | $8,000 | $69,600 |
| 2018 | $0 | $74,800 | $8,000 | $66,800 |
| 2017 | $0 | $72,200 | $7,000 | $65,200 |
| 2016 | $0 | $63,800 | $7,000 | $56,800 |
| 2015 | -- | $63,800 | $7,000 | $56,800 |
| 2014 | -- | $63,800 | $7,000 | $56,800 |
| 2013 | -- | $60,100 | $7,000 | $53,100 |
Source: Public Records
Map
Nearby Homes