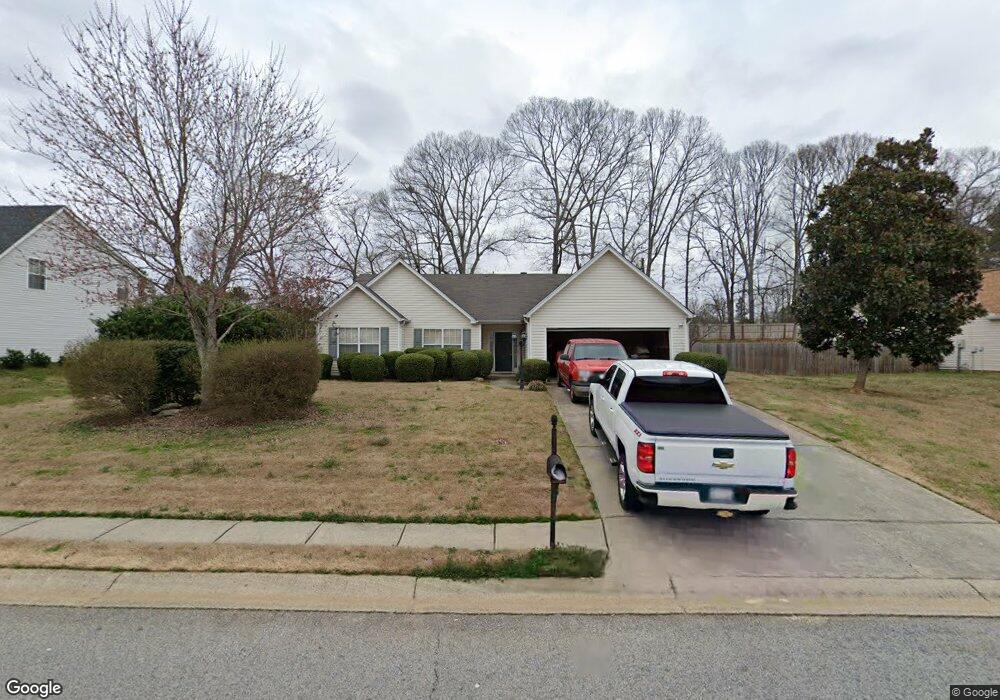
791 Baskins Cir Unit 3 Winder, GA 30680
Estimated Value: $301,000 - $326,000
3
Beds
2
Baths
1,671
Sq Ft
$188/Sq Ft
Est. Value
About This Home
This home is located at 791 Baskins Cir Unit 3, Winder, GA 30680 and is currently estimated at $314,685, approximately $188 per square foot. 791 Baskins Cir Unit 3 is a home located in Barrow County with nearby schools including County Line Elementary School, Russell Middle School, and Winder-Barrow High School.
Ownership History
Date
Name
Owned For
Owner Type
Purchase Details
Closed on
Feb 5, 2013
Sold by
Tansey Brian L
Bought by
Wood Charles Thomas
Current Estimated Value
Purchase Details
Closed on
Aug 6, 2012
Sold by
Tansey Poppy Mathews
Bought by
Tansey Brian Luke
Purchase Details
Closed on
Aug 12, 2003
Sold by
Tansey Brian L
Bought by
Tansey Brian L and Tansey Poppy
Home Financials for this Owner
Home Financials are based on the most recent Mortgage that was taken out on this home.
Original Mortgage
$28,000
Interest Rate
5.72%
Mortgage Type
Stand Alone Second
Purchase Details
Closed on
Jun 29, 2001
Sold by
Windmark Homes
Bought by
Tansey Brian L
Home Financials for this Owner
Home Financials are based on the most recent Mortgage that was taken out on this home.
Original Mortgage
$121,952
Interest Rate
7.23%
Mortgage Type
FHA
Create a Home Valuation Report for This Property
The Home Valuation Report is an in-depth analysis detailing your home's value as well as a comparison with similar homes in the area
Home Values in the Area
Average Home Value in this Area
Purchase History
We collect this data history from publicly available records. To have your information removed, we recommend requesting removal directly through your county’s website.
| Date | Buyer | Sale Price | Title Company |
|---|---|---|---|
| Wood Charles Thomas | $87,451 | -- | |
| Tansey Brian Luke | -- | -- | |
| Tansey Brian L | -- | -- | |
| Tansey Brian L | $123,000 | -- |
Source: Public Records
Mortgage History
We collect this data history from publicly available records. To have your information removed, we recommend requesting removal directly through your county’s website.
| Date | Status | Borrower | Loan Amount |
|---|---|---|---|
| Previous Owner | Tansey Brian L | $28,000 | |
| Previous Owner | Tansey Brian L | $112,000 | |
| Previous Owner | Tansey Brian L | $121,952 |
Source: Public Records
Tax History
| Year | Tax Paid | Tax Assessment Tax Assessment Total Assessment is a certain percentage of the fair market value that is determined by local assessors to be the total taxable value of land and additions on the property. | Land | Improvement |
|---|---|---|---|---|
| 2025 | $2,901 | $104,316 | $16,356 | $87,960 |
| 2024 | $2,952 | $104,316 | $27,200 | $77,116 |
| 2023 | $1,859 | $65,180 | $16,000 | $49,180 |
| 2022 | $2,246 | $65,180 | $16,000 | $49,180 |
| 2021 | $2,043 | $65,180 | $16,000 | $49,180 |
| 2020 | $1,958 | $55,676 | $14,000 | $41,676 |
| 2019 | $1,922 | $53,799 | $14,000 | $39,799 |
| 2018 | $1,984 | $55,812 | $11,600 | $44,212 |
| 2017 | $1,357 | $45,478 | $11,600 | $33,878 |
| 2016 | $1,456 | $42,561 | $11,600 | $30,961 |
| 2015 | $1,458 | $42,561 | $11,600 | $30,961 |
| 2014 | $1,374 | $39,795 | $6,860 | $32,935 |
| 2013 | -- | $37,724 | $6,860 | $30,864 |
Source: Public Records
Map
Nearby Homes
- 421 Regan Dr
- 716 Michael Dr
- 615 Wellington Dr
- 667 Wellington Dr
- 879 Hawk Creek Trail
- 857 Laurel Ln
- 569 Maddox Rd
- 536 Valley View Dr
- 854 Hawk Creek Trail
- 932 Century Oak Dr
- 563 Rockwell Church Rd NW
- 0 Gainesville Hwy Unit 10712053
- 909 Century Oak Dr Unit 2
- 882 Whispering Way
- 2050 Whispering Way
- 858 Pine Shadow Ln
- 236 Hidden Ct
- 326 Fayette Dr
- 223 Lacey Ln
- 615 Gainesville Hwy
- 793 Baskins Cir
- 789 Baskins Cir
- 795 Baskins Cir Unit 3
- 787 Baskins Cir
- 790 Baskins Cir
- 792 Baskins Cir
- 792 Baskins Cir Unit 1
- 788 Baskins Cir
- 788 Baskins Cir Unit B
- 794 Baskins Cir Unit 3
- 794 Baskins Cir
- 785 Baskins Cir
- 797 Baskins Cir Unit 3
- 786 Baskins Cir
- 796 Baskins Cir
- 408 Regan Dr
- 406 Regan Dr
- 783 Baskins Cir Unit 3
- 784 Baskins Cir Unit 3
- 799 Baskins Cir
Your Personal Tour Guide
Ask me questions while you tour the home.