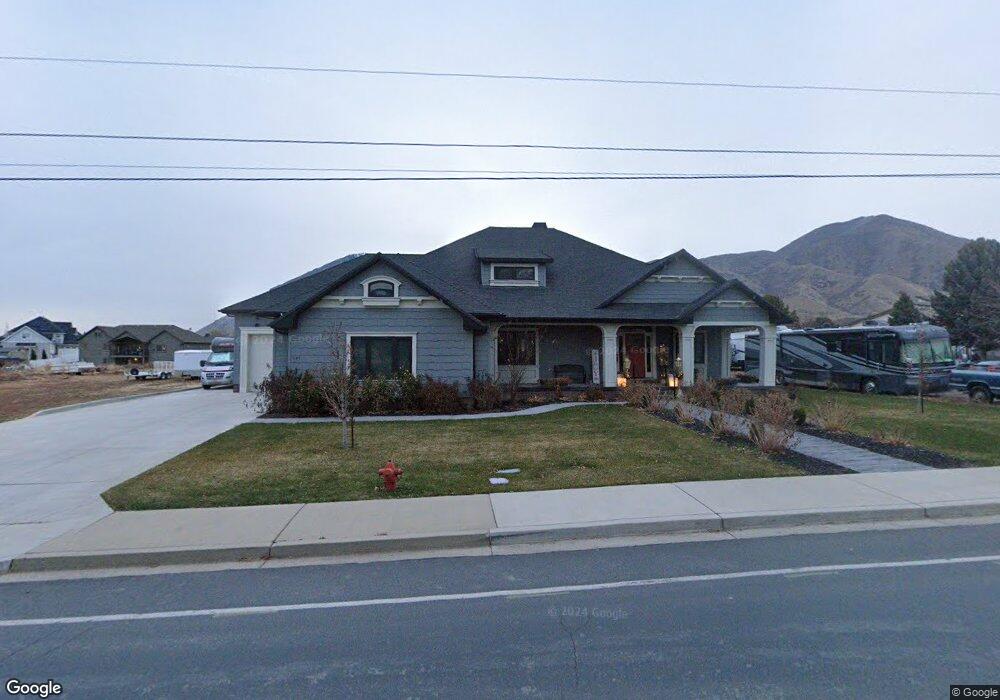
791 E 1200 N Mapleton, UT 84664
Estimated Value: $1,134,000 - $1,189,718
2
Beds
4
Baths
2,773
Sq Ft
$419/Sq Ft
Est. Value
About This Home
This home is located at 791 E 1200 N, Mapleton, UT 84664 and is currently estimated at $1,161,859, approximately $418 per square foot. 791 E 1200 N is a home with nearby schools including Hobble Creek School, Mapleton Junior High School, and Maple Mountain High School.
Ownership History
Date
Name
Owned For
Owner Type
Purchase Details
Closed on
Nov 19, 2019
Sold by
Ferguson James M and Ferguson Judy A
Bought by
Ferguson James M and Ferguson Judy A
Current Estimated Value
Home Financials for this Owner
Home Financials are based on the most recent Mortgage that was taken out on this home.
Original Mortgage
$438,000
Outstanding Balance
$386,319
Interest Rate
3.73%
Mortgage Type
New Conventional
Estimated Equity
$775,540
Purchase Details
Closed on
Apr 4, 2017
Sold by
Antonio Gary Lynn and Antonio Arlene Whiting
Bought by
Ferguson Chad D and Ferguson Summer G
Home Financials for this Owner
Home Financials are based on the most recent Mortgage that was taken out on this home.
Original Mortgage
$30,000
Interest Rate
4.1%
Mortgage Type
Credit Line Revolving
Create a Home Valuation Report for This Property
The Home Valuation Report is an in-depth analysis detailing your home's value as well as a comparison with similar homes in the area
Home Values in the Area
Average Home Value in this Area
Purchase History
| Date | Buyer | Sale Price | Title Company |
|---|---|---|---|
| Ferguson James M | -- | Stewart Title Ins Agcy Of Ut | |
| Ferguson Chad D | -- | Stewart Title Ins Agency |
Source: Public Records
Mortgage History
| Date | Status | Borrower | Loan Amount |
|---|---|---|---|
| Open | Ferguson James M | $438,000 | |
| Closed | Ferguson Chad D | $30,000 |
Source: Public Records
Tax History
| Year | Tax Paid | Tax Assessment Tax Assessment Total Assessment is a certain percentage of the fair market value that is determined by local assessors to be the total taxable value of land and additions on the property. | Land | Improvement |
|---|---|---|---|---|
| 2025 | $5,253 | $599,885 | -- | -- |
| 2024 | $5,253 | $514,635 | $0 | $0 |
| 2023 | $5,381 | $530,475 | $0 | $0 |
| 2022 | $5,073 | $494,505 | $0 | $0 |
| 2021 | $4,246 | $653,600 | $164,600 | $489,000 |
| 2020 | $4,256 | $634,700 | $145,700 | $489,000 |
| 2019 | $4,256 | $628,800 | $139,800 | $489,000 |
| 2018 | $2,853 | $220,715 | $0 | $0 |
Source: Public Records
Map
Nearby Homes
- 1096 N 1000 E
- 1567 N 600 E Unit 26
- 594 E 1000 N
- 435 E 1000 N
- 775 N 800 E
- 1447 N 1350 St E Unit 5
- 1577 N 1350 St E Unit 1
- 1477 N 1350 St E Unit 4
- 1547 N 1350 St E Unit 2
- 1511 N 1350 St E Unit 3
- 1548 N 1350 St E Unit 11
- 1578 N 1350 St E Unit 12
- 1350 N Main St
- 1564 N 1700 East St
- 265 E 600 N
- 1096 Valley Sage Dr
- 1052 Cove Dr
- 310 N 800 E
- 829 S 2200 E
- 1092 Valley Sage Dr
Your Personal Tour Guide
Ask me questions while you tour the home.