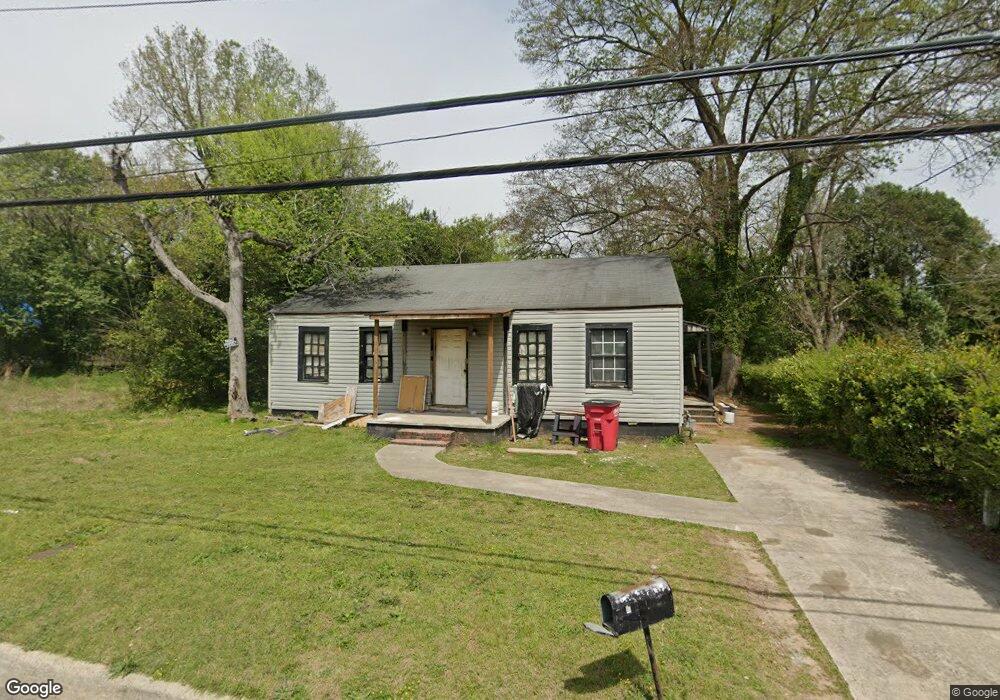
791 Lynmore Ave Macon, GA 31206
Estimated Value: $56,000 - $63,539
2
Beds
1
Bath
988
Sq Ft
$60/Sq Ft
Est. Value
About This Home
This home is located at 791 Lynmore Ave, Macon, GA 31206 and is currently estimated at $59,635, approximately $60 per square foot. 791 Lynmore Ave is a home located in Bibb County with nearby schools including Bruce Elementary School, Rutland Middle School, and Rutland High School.
Ownership History
Date
Name
Owned For
Owner Type
Purchase Details
Closed on
Mar 29, 2021
Sold by
Green Stafford Deshone
Bought by
24 60 Supply And Demand Llc
Current Estimated Value
Purchase Details
Closed on
Jul 18, 2011
Sold by
Coleman Properties Inc
Bought by
Pitts Pauline
Home Financials for this Owner
Home Financials are based on the most recent Mortgage that was taken out on this home.
Original Mortgage
$11,800
Interest Rate
4.53%
Mortgage Type
Purchase Money Mortgage
Purchase Details
Closed on
Apr 19, 2011
Sold by
Federal National Mortgage Association
Bought by
Coleman Properties Inc
Purchase Details
Closed on
Feb 1, 2011
Sold by
Moore Rodney
Bought by
M&T Bank
Purchase Details
Closed on
Apr 5, 2002
Bought by
Moore Rodney
Purchase Details
Closed on
Mar 1, 2002
Create a Home Valuation Report for This Property
The Home Valuation Report is an in-depth analysis detailing your home's value as well as a comparison with similar homes in the area
Home Values in the Area
Average Home Value in this Area
Purchase History
| Date | Buyer | Sale Price | Title Company |
|---|---|---|---|
| 24 60 Supply And Demand Llc | -- | None Available | |
| Pitts Pauline | $11,100 | None Available | |
| Coleman Properties Inc | $6,000 | None Available | |
| M&T Bank | $48,500 | -- | |
| Federal National Mortgage Association | $48,459 | None Available | |
| M & T Bank | $48,458 | None Available | |
| Moore Rodney | $53,000 | -- | |
| -- | $27,000 | -- |
Source: Public Records
Mortgage History
| Date | Status | Borrower | Loan Amount |
|---|---|---|---|
| Previous Owner | Pitts Pauline | $11,800 |
Source: Public Records
Tax History Compared to Growth
Tax History
| Year | Tax Paid | Tax Assessment Tax Assessment Total Assessment is a certain percentage of the fair market value that is determined by local assessors to be the total taxable value of land and additions on the property. | Land | Improvement |
|---|---|---|---|---|
| 2025 | $345 | $14,030 | $2,000 | $12,030 |
| 2024 | $340 | $13,396 | $2,000 | $11,396 |
| 2023 | $340 | $13,396 | $2,000 | $11,396 |
| 2022 | $291 | $8,418 | $1,174 | $7,244 |
| 2021 | $188 | $4,950 | $1,057 | $3,893 |
| 2020 | $164 | $4,226 | $1,057 | $3,169 |
| 2019 | $165 | $4,226 | $1,057 | $3,169 |
| 2018 | $392 | $3,538 | $822 | $2,716 |
| 2017 | $133 | $3,538 | $822 | $2,716 |
| 2016 | $122 | $3,538 | $822 | $2,716 |
| 2015 | $195 | $3,991 | $822 | $3,169 |
| 2014 | $344 | $6,100 | $940 | $5,161 |
Source: Public Records
Map
Nearby Homes
- 730 Villa Esta Ave
- 3897 Tela Place
- 830 Beddingfield Ave
- 826 W Grenada Terrace
- 863 Richmond St
- 3861 Myrtle Ct
- 697 Grenada Terrace
- 3937 Guyton St
- 3415 San Juan Ave
- 3828 Lyons St
- 631 Grenada Terrace
- 3671 Lyons Place
- 656 Villa Crest Ave
- 562 Villa Esta Cir
- 3811 Lyons St
- 3967 Guyton St
- 1016 W Grenada Terrace
- 779 Lynmore Ave
- 811 Lynmore Ave
- 748 Villa Esta Ave
- 760 Villa Esta Ave
- 742 Villa Esta Ave
- 829 Lynmore Ave
- 767 Lynmore Ave
- 736 Villa Esta Ave
- 782 Lynmore Ave
- 806 Lynmore Ave
- 845 Lynmore Ave
- 755 Lynmore Ave
- 818 Lynmore Ave
- 3815 Tela Place
- 724 Villa Esta Ave
- 743 Lynmore Ave
- 3845 Tela Place
- 718 Villa Esta Ave
- 3863 Tela Place
- 731 Lynmore Ave