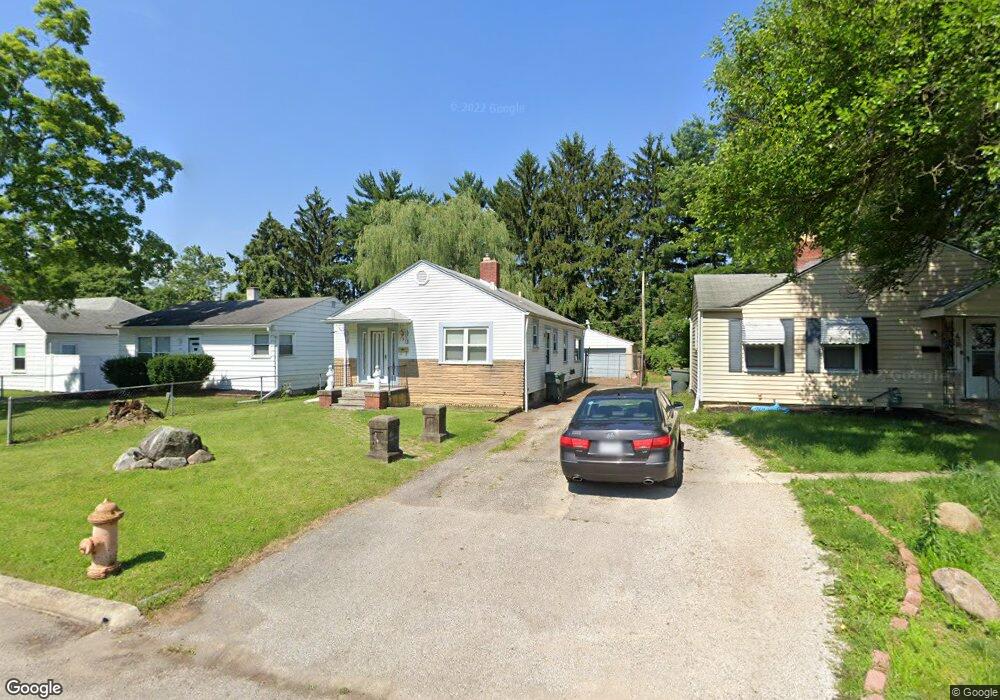
791 N Drexel Ave Columbus, OH 43219
Estimated Value: $142,000 - $157,985
2
Beds
1
Bath
1,056
Sq Ft
$143/Sq Ft
Est. Value
About This Home
This home is located at 791 N Drexel Ave, Columbus, OH 43219 and is currently estimated at $151,496, approximately $143 per square foot. 791 N Drexel Ave is a home located in Franklin County with nearby schools including East Columbus Elementary School, Champion Middle School, and East High School.
Ownership History
Date
Name
Owned For
Owner Type
Purchase Details
Closed on
Jun 2, 2003
Sold by
Miller Samuel
Bought by
Miller Carolyn K
Current Estimated Value
Purchase Details
Closed on
Oct 8, 1997
Sold by
Vick Properties Inc
Bought by
Miller Carolyn K
Home Financials for this Owner
Home Financials are based on the most recent Mortgage that was taken out on this home.
Original Mortgage
$55,555
Outstanding Balance
$9,122
Interest Rate
7.7%
Mortgage Type
FHA
Estimated Equity
$142,374
Purchase Details
Closed on
Jun 30, 1997
Sold by
Bankers Trust Company Of California Na
Bought by
Vick Properties Inc
Home Financials for this Owner
Home Financials are based on the most recent Mortgage that was taken out on this home.
Original Mortgage
$30,000
Interest Rate
8%
Purchase Details
Closed on
Mar 25, 1997
Sold by
Shrf Michael N Phipps Pr
Bought by
Bank Trust Co
Create a Home Valuation Report for This Property
The Home Valuation Report is an in-depth analysis detailing your home's value as well as a comparison with similar homes in the area
Home Values in the Area
Average Home Value in this Area
Purchase History
| Date | Buyer | Sale Price | Title Company |
|---|---|---|---|
| Miller Carolyn K | -- | -- | |
| Miller Carolyn K | $55,900 | Ohio Title Agency | |
| Vick Properties Inc | $24,000 | Ohio Title Agency Inc | |
| Bank Trust Co | $24,600 | -- |
Source: Public Records
Mortgage History
| Date | Status | Borrower | Loan Amount |
|---|---|---|---|
| Open | Miller Carolyn K | $55,555 | |
| Previous Owner | Vick Properties Inc | $30,000 | |
| Closed | Miller Carolyn K | $1,000 |
Source: Public Records
Tax History Compared to Growth
Tax History
| Year | Tax Paid | Tax Assessment Tax Assessment Total Assessment is a certain percentage of the fair market value that is determined by local assessors to be the total taxable value of land and additions on the property. | Land | Improvement |
|---|---|---|---|---|
| 2024 | $2,129 | $47,430 | $9,210 | $38,220 |
| 2023 | $2,101 | $47,425 | $9,205 | $38,220 |
| 2022 | $908 | $17,500 | $1,540 | $15,960 |
| 2021 | $909 | $17,500 | $1,540 | $15,960 |
| 2020 | $910 | $17,500 | $1,540 | $15,960 |
| 2019 | $958 | $15,790 | $1,400 | $14,390 |
| 2018 | $1,007 | $15,790 | $1,400 | $14,390 |
| 2017 | $1,062 | $15,790 | $1,400 | $14,390 |
| 2016 | $1,167 | $17,610 | $2,280 | $15,330 |
| 2015 | $1,059 | $17,610 | $2,280 | $15,330 |
| 2014 | $1,062 | $17,610 | $2,280 | $15,330 |
| 2013 | $615 | $20,685 | $2,660 | $18,025 |
Source: Public Records
Map
Nearby Homes
- 782 Northview Ave
- 796 Northview Ave
- 696 Northview Ave
- 2742 E 5th Ave
- 797 N Nelson Rd
- 2822-2824 E 5th Ave
- 2814 E 9th Ave
- 2718 Roxbury Rd
- 2287 Margaret Ave Unit 289
- 2857 E 10th Ave
- 2278 Ridgeway Ave Unit 278
- 2250 Willamont Ave
- 2812 E 11th Ave
- 799 Alton Ave
- 1065 Sunbury Rd
- 2779 Columbus Ave
- 2969 E 11th Ave
- 0 E 7th Ave Unit Lot 79 225013171
- 0 E 7th Ave Unit Lot 77 225013170
- 0 E 7th Ave Unit Lot 78 225013168
- 797 N Drexel Ave
- 785 N Drexel Ave
- 777 N Drexel Ave
- 807 N Drexel Ave
- 790 N Drexel Ave
- 796 N Drexel Ave
- 786 N Drexel Ave
- 802 N Drexel Ave
- 776 N Drexel Ave
- 806 N Drexel Ave
- 2570 E 5th Ave
- 2562 E 5th Ave
- 2548 E 5th Ave
- 2590 E 5th Ave
- 0 Northview Ave
- 777 Northview Ave
- 791 Northview Ave
- 0 Northview Ave
- 2600 E 5th Ave
- 771 Northview Ave Unit A - H