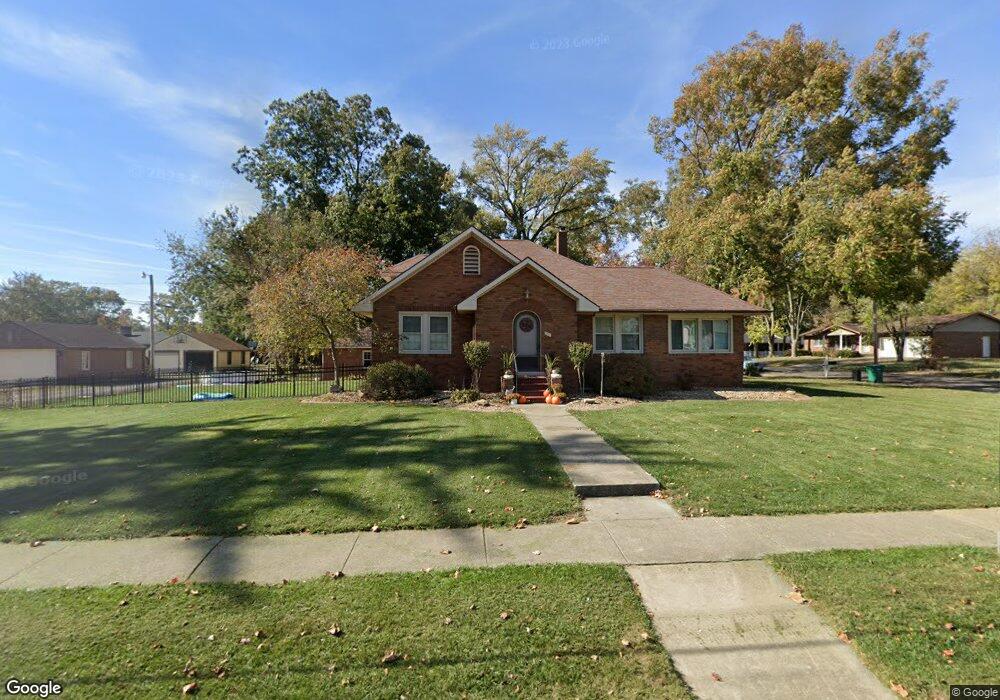
791 N Main St Breese, IL 62230
Estimated Value: $200,180 - $254,000
--
Bed
--
Bath
1,750
Sq Ft
$129/Sq Ft
Est. Value
About This Home
This home is located at 791 N Main St, Breese, IL 62230 and is currently estimated at $225,045, approximately $128 per square foot. 791 N Main St is a home located in Clinton County with nearby schools including Breese ESD #12, Beckemeyer Elementary School, and Central Community High School.
Ownership History
Date
Name
Owned For
Owner Type
Purchase Details
Closed on
Sep 11, 2015
Sold by
Lohman Ronda L and Dasenbrock Eric
Bought by
Schaubert Kevin D
Current Estimated Value
Home Financials for this Owner
Home Financials are based on the most recent Mortgage that was taken out on this home.
Original Mortgage
$132,653
Outstanding Balance
$102,709
Interest Rate
3.5%
Mortgage Type
New Conventional
Estimated Equity
$122,336
Purchase Details
Closed on
May 19, 2010
Sold by
Tonnies Robert and Alarie Donna A
Bought by
Lohman Ronda L
Home Financials for this Owner
Home Financials are based on the most recent Mortgage that was taken out on this home.
Original Mortgage
$137,902
Interest Rate
5.13%
Mortgage Type
VA
Purchase Details
Closed on
Dec 29, 2006
Sold by
Tatham Gary W
Bought by
Tonnies Robert and Alarie Donna A
Create a Home Valuation Report for This Property
The Home Valuation Report is an in-depth analysis detailing your home's value as well as a comparison with similar homes in the area
Home Values in the Area
Average Home Value in this Area
Purchase History
| Date | Buyer | Sale Price | Title Company |
|---|---|---|---|
| Schaubert Kevin D | $130,000 | None Available | |
| Lohman Ronda L | $135,000 | None Available | |
| Tonnies Robert | $110,000 | None Available |
Source: Public Records
Mortgage History
| Date | Status | Borrower | Loan Amount |
|---|---|---|---|
| Open | Schaubert Kevin D | $132,653 | |
| Previous Owner | Lohman Ronda L | $137,902 |
Source: Public Records
Tax History Compared to Growth
Tax History
| Year | Tax Paid | Tax Assessment Tax Assessment Total Assessment is a certain percentage of the fair market value that is determined by local assessors to be the total taxable value of land and additions on the property. | Land | Improvement |
|---|---|---|---|---|
| 2024 | $3,778 | $60,810 | $21,440 | $39,370 |
| 2023 | $3,778 | $57,370 | $20,230 | $37,140 |
| 2022 | $3,735 | $52,150 | $18,390 | $33,760 |
| 2021 | $3,345 | $49,660 | $17,510 | $32,150 |
| 2020 | $3,270 | $47,750 | $16,840 | $30,910 |
| 2019 | $3,209 | $47,750 | $16,840 | $30,910 |
| 2018 | $2,895 | $41,610 | $13,582 | $28,028 |
| 2017 | $2,811 | $40,010 | $13,060 | $26,950 |
| 2016 | $2,785 | $40,010 | $13,060 | $26,950 |
| 2015 | $2,461 | $40,010 | $13,060 | $26,950 |
| 2013 | $2,461 | $40,940 | $13,060 | $27,880 |
Source: Public Records
Map
Nearby Homes
- 325 N Walnut St
- 923 N 6th St
- 290 N Elm St
- 436 S 2nd St
- 13898 Lincoln Dr
- 13964 Best One Dr
- 330 S 5th St
- 429 S 6th St
- 620 S 6th St
- 126 Jefferson Dr
- 10675 Buckingham Ct
- 14501 Saint Rose Rd
- 751 E 4th St
- 315 Briarwood Ln
- 10 S Hull St
- 560 W 4th St
- 8130 Main St
- 15556 Old State Rd
- 1102 Cherry St
- 12702 Crestview Ln