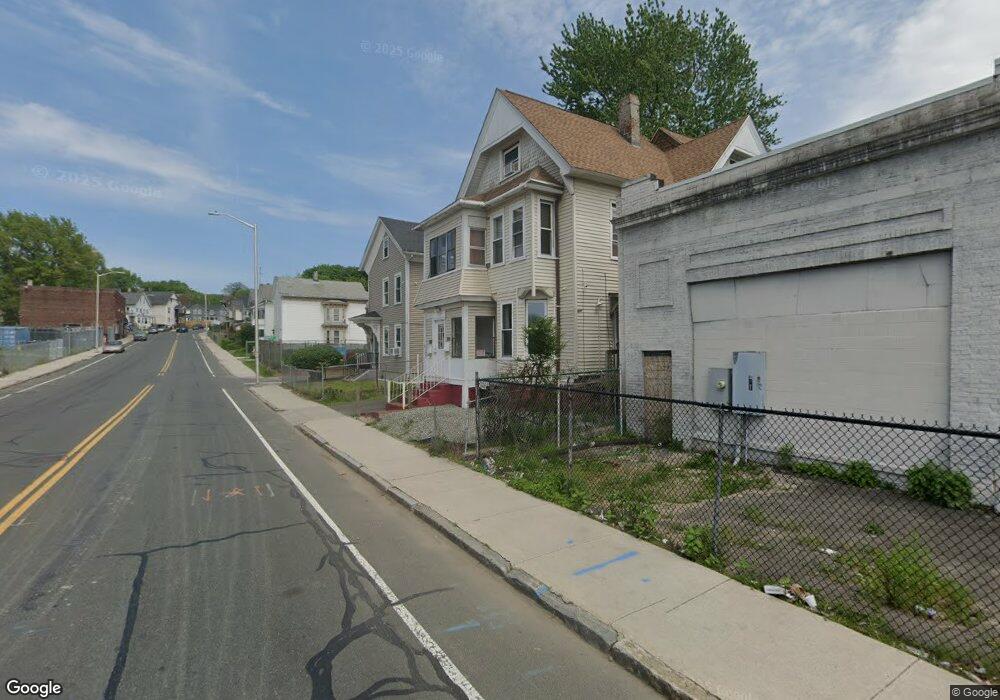
791 Worthington St Springfield, MA 01105
Metro Center NeighborhoodEstimated Value: $269,000 - $313,424
8
Beds
2
Baths
2,651
Sq Ft
$108/Sq Ft
Est. Value
About This Home
This home is located at 791 Worthington St, Springfield, MA 01105 and is currently estimated at $287,356, approximately $108 per square foot. 791 Worthington St is a home located in Hampden County with nearby schools including High School Of Commerce, Springfield High School of Science and Technology, and Roger L. Putnam Vocational Technical Academy.
Ownership History
Date
Name
Owned For
Owner Type
Purchase Details
Closed on
Aug 2, 2022
Sold by
Taqi Samina and Taqi Muhammad
Bought by
Alis Associates Llc
Current Estimated Value
Purchase Details
Closed on
Sep 18, 2020
Sold by
Anwar Properties Llc
Bought by
Taqi Samina and Taqi Muhammad
Home Financials for this Owner
Home Financials are based on the most recent Mortgage that was taken out on this home.
Original Mortgage
$120,000
Interest Rate
2.8%
Mortgage Type
New Conventional
Purchase Details
Closed on
Sep 8, 2014
Sold by
Springfield City Of
Bought by
Anwar Properties Llc
Purchase Details
Closed on
Nov 7, 2003
Sold by
Maldonado Carlos J and Maldonado Carlos
Bought by
Bou Jose O
Purchase Details
Closed on
Mar 16, 1995
Sold by
Bank Of Boston
Bought by
Bou Jose O
Purchase Details
Closed on
Jul 8, 1994
Sold by
Small Mark A
Bought by
First Natl Bk Boston
Create a Home Valuation Report for This Property
The Home Valuation Report is an in-depth analysis detailing your home's value as well as a comparison with similar homes in the area
Home Values in the Area
Average Home Value in this Area
Purchase History
| Date | Buyer | Sale Price | Title Company |
|---|---|---|---|
| Alis Associates Llc | -- | None Available | |
| Taqi Samina | $160,000 | None Available | |
| Anwar Properties Llc | $13,125 | -- | |
| Bou Jose O | -- | -- | |
| Bou Jose O | $4,200 | -- | |
| First Natl Bk Boston | $22,500 | -- |
Source: Public Records
Mortgage History
| Date | Status | Borrower | Loan Amount |
|---|---|---|---|
| Previous Owner | Taqi Samina | $120,000 | |
| Previous Owner | First Natl Bk Boston | $29,668 | |
| Previous Owner | First Natl Bk Boston | $6,000 | |
| Previous Owner | First Natl Bk Boston | $72,900 |
Source: Public Records
Tax History
| Year | Tax Paid | Tax Assessment Tax Assessment Total Assessment is a certain percentage of the fair market value that is determined by local assessors to be the total taxable value of land and additions on the property. | Land | Improvement |
|---|---|---|---|---|
| 2025 | $4,528 | $288,800 | $24,200 | $264,600 |
| 2024 | $3,782 | $235,500 | $22,600 | $212,900 |
| 2023 | $3,060 | $179,500 | $21,500 | $158,000 |
| 2022 | $3,196 | $169,800 | $19,600 | $150,200 |
| 2021 | $2,856 | $151,100 | $17,800 | $133,300 |
| 2020 | $2,660 | $136,200 | $17,800 | $118,400 |
| 2019 | $2,584 | $131,300 | $17,800 | $113,500 |
| 2018 | $2,606 | $132,400 | $17,800 | $114,600 |
| 2017 | $2,593 | $131,900 | $17,100 | $114,800 |
| 2016 | $2,235 | $113,700 | $17,100 | $96,600 |
| 2015 | -- | $94,300 | $17,100 | $77,200 |
Source: Public Records
Map
Nearby Homes
- 69 Winter St
- 40 Byers St
- 14 Crane St
- 14-16 Wolcott St
- LOT 3 N S Worthington St
- 140 Chestnut St Unit 706
- 140 Chestnut St Unit 702
- 140 Chestnut St Unit 204
- 140 Chestnut St Unit 819
- 140 Chestnut St Unit 619
- 140 Chestnut St Unit 816
- 140 Chestnut St Unit 604
- 140 Chestnut St Unit 407
- 148-150 Stafford St
- 63 Oak St
- 0 Maple St
- 63 Bay St
- 41 Florida St
- 15 Florida St
- 123 Bay St
- 787 Worthington St
- 785 Worthington St Unit 1st fl
- 801 Worthington St
- 807 Worthington St
- 811 Worthington St
- 819 Worthington St
- 208 Pearl St Unit 210-4L
- 208 Pearl St Unit 210-2R
- 208 Pearl St Unit 210-3R
- 208 Pearl St Unit 212
- 1 Extract Place
- 818 Worthington St
- 825 Worthington St
- 212 Pearl St
- 202 Pearl St Unit 204-4L
- 202 Pearl St Unit 1R
- 204 Pearl St
- 202 Pearl St
- 202 Pearl St Unit 206
- 12 Kibbe Ave
Your Personal Tour Guide
Ask me questions while you tour the home.