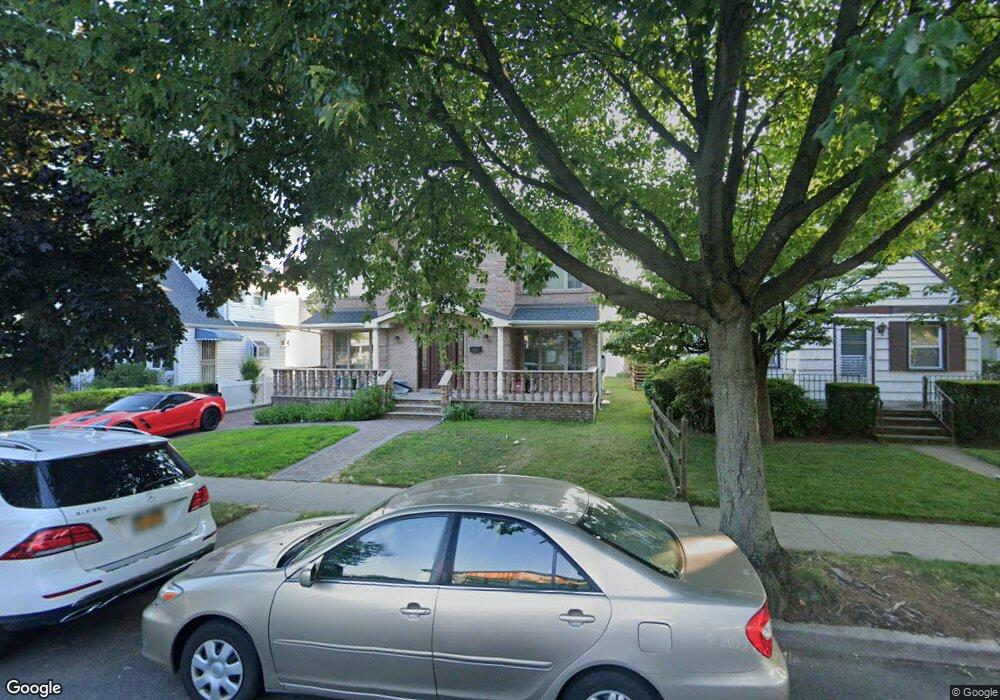
7910 261st St Glen Oaks, NY 11004
Estimated Value: $1,071,000 - $1,540,000
--
Bed
--
Bath
2,016
Sq Ft
$599/Sq Ft
Est. Value
About This Home
This home is located at 7910 261st St, Glen Oaks, NY 11004 and is currently estimated at $1,207,535, approximately $598 per square foot. 7910 261st St is a home located in Queens County with nearby schools including P.S.115Q James J Ambrose School, Irwin Altman Middle School 172, and Martin Van Buren High School.
Ownership History
Date
Name
Owned For
Owner Type
Purchase Details
Closed on
Nov 28, 2011
Sold by
Oommen Alice P and Oommen Varughese
Bought by
Leung Christopher J and Leung Nicholas J
Current Estimated Value
Purchase Details
Closed on
Sep 14, 2006
Sold by
Juman Farieza
Bought by
Oommen Alice P and Oommen Varghese
Home Financials for this Owner
Home Financials are based on the most recent Mortgage that was taken out on this home.
Original Mortgage
$448,000
Interest Rate
6.48%
Mortgage Type
Purchase Money Mortgage
Purchase Details
Closed on
Nov 10, 2004
Sold by
Schmulbach Executrix Barbara and Schwartz Estate Of Sidney
Bought by
Juman Farieza
Home Financials for this Owner
Home Financials are based on the most recent Mortgage that was taken out on this home.
Original Mortgage
$53,700
Interest Rate
5.75%
Create a Home Valuation Report for This Property
The Home Valuation Report is an in-depth analysis detailing your home's value as well as a comparison with similar homes in the area
Home Values in the Area
Average Home Value in this Area
Purchase History
| Date | Buyer | Sale Price | Title Company |
|---|---|---|---|
| Leung Christopher J | $840,000 | -- | |
| Leung Christopher J | $840,000 | -- | |
| Oommen Alice P | $560,000 | -- | |
| Oommen Alice P | $560,000 | -- | |
| Juman Farieza | $537,000 | -- | |
| Juman Farieza | $537,000 | -- |
Source: Public Records
Mortgage History
| Date | Status | Borrower | Loan Amount |
|---|---|---|---|
| Previous Owner | Oommen Alice P | $448,000 | |
| Previous Owner | Juman Farieza | $53,700 | |
| Previous Owner | Juman Farieza | $429,600 |
Source: Public Records
Tax History Compared to Growth
Tax History
| Year | Tax Paid | Tax Assessment Tax Assessment Total Assessment is a certain percentage of the fair market value that is determined by local assessors to be the total taxable value of land and additions on the property. | Land | Improvement |
|---|---|---|---|---|
| 2025 | $11,282 | $60,240 | $18,296 | $41,944 |
| 2024 | $11,294 | $57,573 | $17,347 | $40,226 |
| 2023 | $10,628 | $54,314 | $17,030 | $37,284 |
| 2022 | $9,368 | $51,240 | $18,060 | $33,180 |
| 2021 | $11,091 | $54,780 | $18,060 | $36,720 |
| 2020 | $10,509 | $54,300 | $18,060 | $36,240 |
| 2019 | $9,781 | $48,540 | $18,060 | $30,480 |
| 2018 | $8,964 | $45,432 | $15,313 | $30,119 |
| 2017 | $8,962 | $45,432 | $17,532 | $27,900 |
| 2016 | $8,704 | $45,432 | $17,532 | $27,900 |
| 2015 | -- | $42,538 | $18,768 | $23,770 |
| 2014 | -- | $40,131 | $17,706 | $22,425 |
Source: Public Records
Map
Nearby Homes
- 80-18 261st St
- 80-37 259th St
- 78-07 264th St
- 80-27 257th St
- 255-31 75th Ave Unit 2nd Floor
- 74-12 260th St Unit H-2
- 8133 260th St
- 81-31 259th St
- 8125 258th St
- 255-9 75th Ave Unit lower
- 254-04 75th Ave Unit G-2
- 260-73 75th Ave Unit 1st Fl
- 8019 266th St
- 80-64 266th St
- 74-04 255th St Unit G-1
- 254-61 75th Ave Unit A11-1
- 79-12 268th St
- 81-25 265th St
- 81-56 264th St
- 8112 255th St