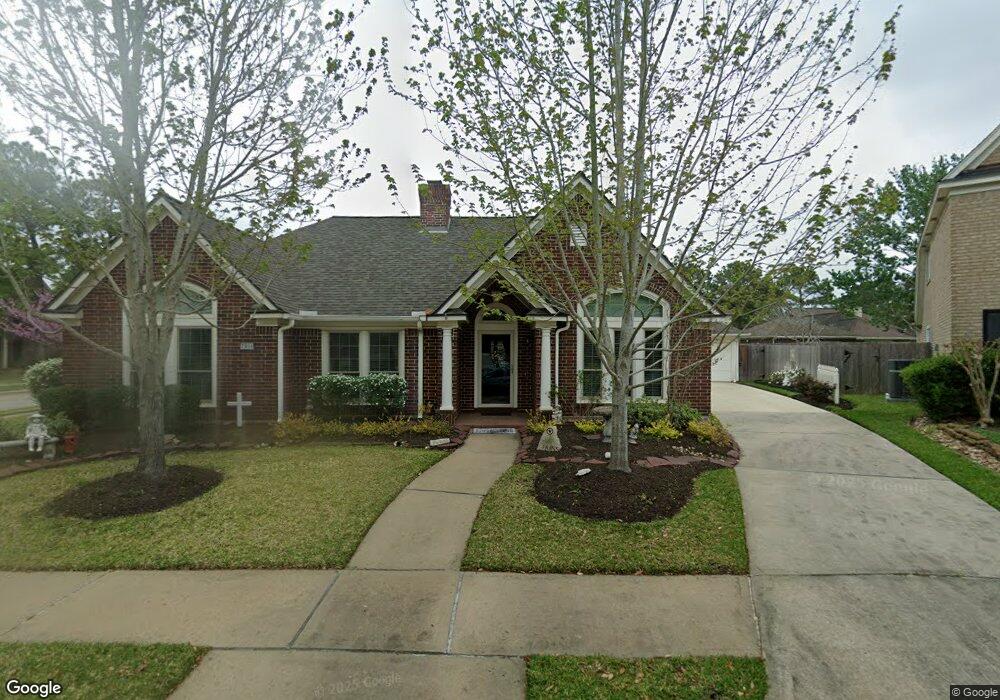
7910 Grand Mountain Ct Houston, TX 77095
Copperfield NeighborhoodEstimated Value: $354,022 - $377,000
4
Beds
2
Baths
2,562
Sq Ft
$142/Sq Ft
Est. Value
About This Home
This home is located at 7910 Grand Mountain Ct, Houston, TX 77095 and is currently estimated at $365,006, approximately $142 per square foot. 7910 Grand Mountain Ct is a home located in Harris County with nearby schools including Copeland Elementary School, Aragon Middle School, and Langham Creek High School.
Ownership History
Date
Name
Owned For
Owner Type
Purchase Details
Closed on
Dec 3, 2009
Sold by
Suter William and Suter Linda
Bought by
Fain Patrick W and Fain Gayle G
Current Estimated Value
Purchase Details
Closed on
Nov 15, 2000
Sold by
Banks John Winston and Banks Susan Marie
Bought by
Suter William and Suter Linda
Home Financials for this Owner
Home Financials are based on the most recent Mortgage that was taken out on this home.
Original Mortgage
$102,000
Interest Rate
7.82%
Purchase Details
Closed on
Apr 9, 1997
Sold by
Ratisher David E and Ratisher Lowana L
Bought by
Banks John Winston and Banks Susan Marie
Home Financials for this Owner
Home Financials are based on the most recent Mortgage that was taken out on this home.
Original Mortgage
$120,000
Interest Rate
6.87%
Create a Home Valuation Report for This Property
The Home Valuation Report is an in-depth analysis detailing your home's value as well as a comparison with similar homes in the area
Home Values in the Area
Average Home Value in this Area
Purchase History
| Date | Buyer | Sale Price | Title Company |
|---|---|---|---|
| Fain Patrick W | -- | Star Tex Title Company 04 | |
| Suter William | -- | -- | |
| Banks John Winston | -- | American Title Co |
Source: Public Records
Mortgage History
| Date | Status | Borrower | Loan Amount |
|---|---|---|---|
| Previous Owner | Suter William | $102,000 | |
| Previous Owner | Banks John Winston | $120,000 |
Source: Public Records
Tax History Compared to Growth
Tax History
| Year | Tax Paid | Tax Assessment Tax Assessment Total Assessment is a certain percentage of the fair market value that is determined by local assessors to be the total taxable value of land and additions on the property. | Land | Improvement |
|---|---|---|---|---|
| 2025 | $1,300 | $335,106 | $68,946 | $266,160 |
| 2024 | $1,300 | $356,815 | $68,946 | $287,869 |
| 2023 | $1,300 | $356,815 | $68,946 | $287,869 |
| 2022 | $6,506 | $295,000 | $49,247 | $245,753 |
| 2021 | $6,206 | $251,168 | $49,247 | $201,921 |
| 2020 | $5,886 | $230,000 | $37,883 | $192,117 |
| 2019 | $5,865 | $223,809 | $37,883 | $185,926 |
| 2018 | $1,073 | $225,000 | $37,883 | $187,117 |
| 2017 | $5,819 | $225,000 | $37,883 | $187,117 |
| 2016 | $5,690 | $238,325 | $37,883 | $200,442 |
| 2015 | $1,775 | $200,000 | $37,883 | $162,117 |
| 2014 | $1,775 | $187,500 | $31,821 | $155,679 |
Source: Public Records
Map
Nearby Homes
- 7807 Hickory Mill Ct
- 7626 Almond Springs Dr
- 17710 Noble Oak Ct
- 17518 Rustling Aspen Ln
- 17310 Crescent Canyon Dr
- 17214 Palm Falls Ct
- 17814 Stoney Glade Ct
- 17326 Masonridge Dr
- 7810 Timberline Run Ln
- 17522 Masonridge Dr
- 17603 Fairgrove Park Dr
- 17010 Poplar Hill St
- 7539 Wildwood Brook Ct
- 17222 Crown Meadow Ct
- 17523 Hamilwood Dr
- 17527 Hamilwood Dr
- 17531 Hamilwood Dr
- 8410 Castle Pond Ct
- 17114 Sheffield Pines Ln
- 16902 Terrace Park Dr
- 7906 Grand Mountain Ct
- 17210 Highland Canyon Dr
- 17214 Highland Canyon Dr
- 7902 Grand Mountain Ct
- 17410 Emerald Isle Dr
- 17406 Emerald Isle Dr
- 17218 Highland Canyon Dr
- 17414 Emerald Isle Dr
- 17402 Emerald Isle Dr
- 17418 Emerald Isle Dr
- 7911 Grand Mountain Ct
- 7907 Grand Mountain Ct
- 7910 Ivy Trail Ct
- 7914 Ivy Trail Ct
- 17222 Highland Canyon Dr
- 7918 Ivy Trail Ct
- 17422 Emerald Isle Dr
- 17339 Emerald Isle Dr
- 7906 Ivy Trail Ct
- 17122 Highland Canyon Dr