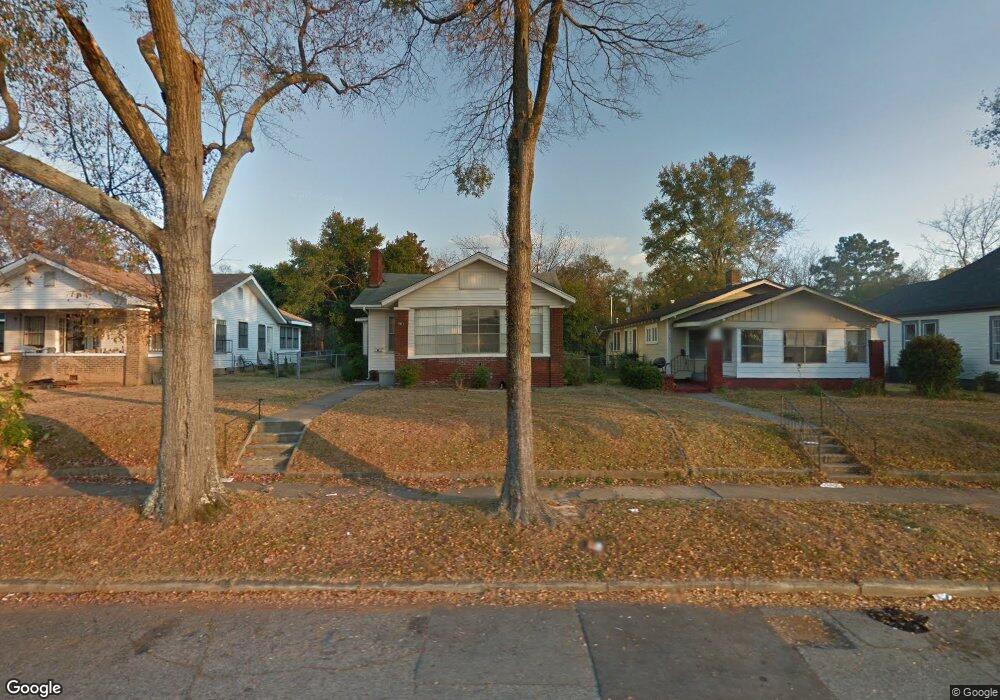
7911 3rd Ave S Birmingham, AL 35206
South Eastlake NeighborhoodEstimated Value: $87,000 - $126,000
4
Beds
2
Baths
1,464
Sq Ft
$73/Sq Ft
Est. Value
About This Home
This home is located at 7911 3rd Ave S, Birmingham, AL 35206 and is currently estimated at $106,628, approximately $72 per square foot. 7911 3rd Ave S is a home located in Jefferson County with nearby schools including Barrett Elementary School, Ossie Ware Mitchell Middle School, and Woodlawn High School-Magnet.
Ownership History
Date
Name
Owned For
Owner Type
Purchase Details
Closed on
May 31, 2023
Sold by
Grace National Holdings Llc
Bought by
Gnh Refi 7 Llc
Current Estimated Value
Purchase Details
Closed on
Apr 19, 2019
Sold by
Venture South Llc
Bought by
Grace National Holdings Llc
Purchase Details
Closed on
Jan 11, 2019
Sold by
J & L Properties Llc
Bought by
Venture South Llc
Purchase Details
Closed on
Sep 12, 2012
Sold by
Hensley Linda D
Bought by
J & L Properties Llc
Purchase Details
Closed on
Jan 2, 2008
Sold by
Brooks Cynthia L
Bought by
Hensley Linda D
Purchase Details
Closed on
Apr 29, 2002
Sold by
Willingham Wanda Sheppard
Bought by
Taylor Kenneth
Create a Home Valuation Report for This Property
The Home Valuation Report is an in-depth analysis detailing your home's value as well as a comparison with similar homes in the area
Home Values in the Area
Average Home Value in this Area
Purchase History
| Date | Buyer | Sale Price | Title Company |
|---|---|---|---|
| Gnh Refi 7 Llc | $1,064,700 | None Listed On Document | |
| Grace National Holdings Llc | $1,960,000 | -- | |
| Venture South Llc | $1,250,000 | -- | |
| J & L Properties Llc | $500 | -- | |
| J & L Properties Llc | $500 | -- | |
| Hensley Linda D | $500 | Ticor Title Insurance | |
| Taylor Kenneth | $23,627 | -- |
Source: Public Records
Tax History Compared to Growth
Tax History
| Year | Tax Paid | Tax Assessment Tax Assessment Total Assessment is a certain percentage of the fair market value that is determined by local assessors to be the total taxable value of land and additions on the property. | Land | Improvement |
|---|---|---|---|---|
| 2024 | $893 | $13,080 | -- | -- |
| 2022 | $885 | $12,340 | $2,680 | $9,660 |
| 2021 | $734 | $10,120 | $2,680 | $7,440 |
| 2020 | $699 | $9,640 | $2,680 | $6,960 |
| 2019 | $699 | $9,640 | $0 | $0 |
| 2018 | $548 | $7,560 | $0 | $0 |
| 2017 | $548 | $7,560 | $0 | $0 |
| 2016 | $548 | $7,560 | $0 | $0 |
| 2015 | $548 | $7,560 | $0 | $0 |
| 2014 | $560 | $7,320 | $0 | $0 |
| 2013 | $560 | $7,320 | $0 | $0 |
Source: Public Records
Map
Nearby Homes
- 7921 3rd Ave S
- 7916 5th Ave S
- 8035 4th Ave S
- 7809 2nd Ave S
- 507 80th St S
- 8032 5th Ave S
- 510 79th St S
- 8025 1st Ave S
- 7912 1st Ave S
- 7915 Division Ave
- 8030 1st Ave S
- 506 78th St S
- 7809 7th Ave S
- 7801 7th Ave S
- 508 Vanderbilt St
- 7741 5th Ave S
- 718 78th St S
- 8201 4th Ave S
- 615 81st Place S
- 7701 7th Ave S