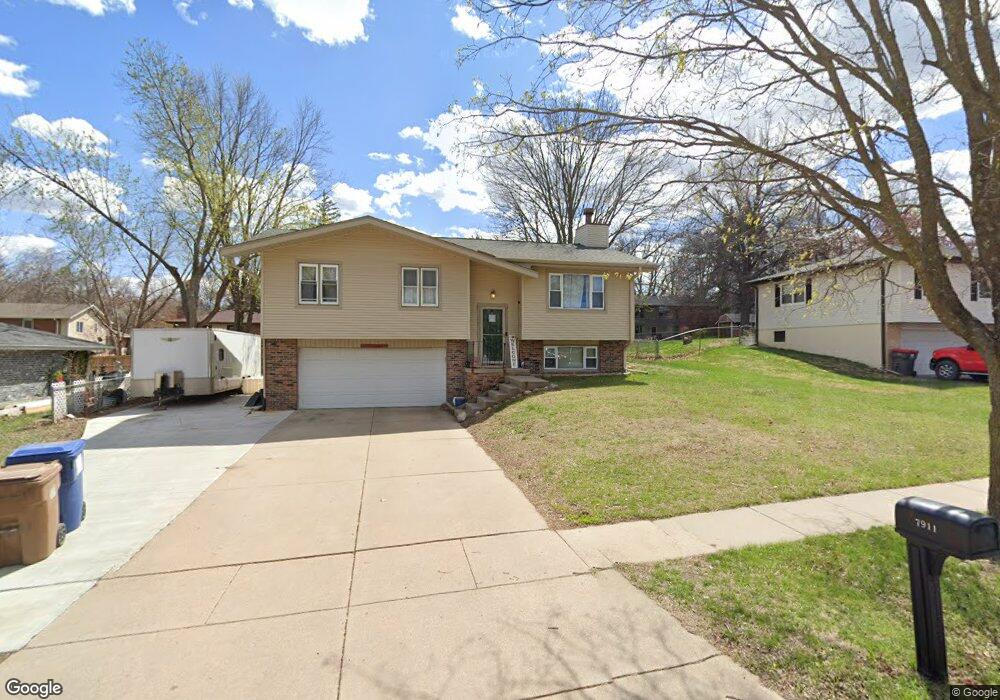
7911 South St Lincoln, NE 68506
Trendwood NeighborhoodEstimated Value: $264,000 - $318,000
3
Beds
4
Baths
1,136
Sq Ft
$260/Sq Ft
Est. Value
About This Home
This home is located at 7911 South St, Lincoln, NE 68506 and is currently estimated at $295,126, approximately $259 per square foot. 7911 South St is a home located in Lancaster County with nearby schools including Morley Elementary School, Lux Middle School, and Lincoln East High School.
Ownership History
Date
Name
Owned For
Owner Type
Purchase Details
Closed on
Feb 12, 2016
Sold by
White Sarah A and Bienka Sarah A
Bought by
White Tyler
Current Estimated Value
Home Financials for this Owner
Home Financials are based on the most recent Mortgage that was taken out on this home.
Original Mortgage
$132,795
Outstanding Balance
$105,649
Interest Rate
3.97%
Mortgage Type
VA
Estimated Equity
$189,477
Purchase Details
Closed on
May 8, 2014
Sold by
Bienka Joshua S
Bought by
Bienka Sarah A
Purchase Details
Closed on
May 25, 2006
Sold by
Hamilton Jeffrey and Hamilton Peggy
Bought by
Bienka Joshua S and Bienka Sarah A
Home Financials for this Owner
Home Financials are based on the most recent Mortgage that was taken out on this home.
Original Mortgage
$100,000
Interest Rate
6.5%
Mortgage Type
Unknown
Purchase Details
Closed on
Apr 28, 2006
Sold by
G & J Co
Bought by
Hamilton Jeffrey S and Hamilton Peggy A
Home Financials for this Owner
Home Financials are based on the most recent Mortgage that was taken out on this home.
Original Mortgage
$100,000
Interest Rate
6.5%
Mortgage Type
Unknown
Purchase Details
Closed on
Apr 26, 2004
Sold by
Mcbride Bryce E and Pentz Mcbride Jana M
Bought by
G & J Co
Create a Home Valuation Report for This Property
The Home Valuation Report is an in-depth analysis detailing your home's value as well as a comparison with similar homes in the area
Home Values in the Area
Average Home Value in this Area
Purchase History
| Date | Buyer | Sale Price | Title Company |
|---|---|---|---|
| White Tyler | $130,000 | Charter Title & Escrow Svcs | |
| Bienka Sarah A | -- | None Available | |
| Bienka Joshua S | $130,000 | None Available | |
| Hamilton Jeffrey S | -- | None Available | |
| G & J Co | $125,000 | -- |
Source: Public Records
Mortgage History
| Date | Status | Borrower | Loan Amount |
|---|---|---|---|
| Open | White Tyler | $132,795 | |
| Previous Owner | Bienka Joshua S | $100,000 |
Source: Public Records
Tax History Compared to Growth
Tax History
| Year | Tax Paid | Tax Assessment Tax Assessment Total Assessment is a certain percentage of the fair market value that is determined by local assessors to be the total taxable value of land and additions on the property. | Land | Improvement |
|---|---|---|---|---|
| 2025 | $3,869 | $270,400 | $60,000 | $210,400 |
| 2024 | $3,869 | $277,200 | $60,000 | $217,200 |
| 2023 | $4,406 | $262,900 | $60,000 | $202,900 |
| 2022 | $4,110 | $206,200 | $55,000 | $151,200 |
| 2021 | $3,888 | $206,200 | $55,000 | $151,200 |
| 2020 | $3,588 | $187,800 | $55,000 | $132,800 |
| 2019 | $3,589 | $187,800 | $55,000 | $132,800 |
| 2018 | $3,173 | $165,300 | $55,000 | $110,300 |
| 2017 | $3,202 | $165,300 | $55,000 | $110,300 |
| 2016 | $2,804 | $144,000 | $45,000 | $99,000 |
| 2015 | $2,785 | $144,000 | $45,000 | $99,000 |
| 2014 | $2,573 | $132,300 | $45,000 | $87,300 |
| 2013 | -- | $132,300 | $45,000 | $87,300 |
Source: Public Records
Map
Nearby Homes
- 7811 South St
- 2120 S 77th St
- 8120 South St
- 2131 Larchdale Dr
- 1901 Pinedale Ave
- 2625 Arrow Ridge Place
- 2410 S 75th St
- 9131 South St
- 9500 South St
- 7410 Old Post Rd Unit 5
- 7300 South St Unit 13
- 7300 South St Unit 4
- 7311 Old Post Rd Unit 19
- 1701 Buckingham Dr
- 1625 S 77th St
- 2701 S 74th St
- 1601 Devoe Dr
- 7500 Otoe Place
- 7501 Otoe Place
- 1600 Regency Dr