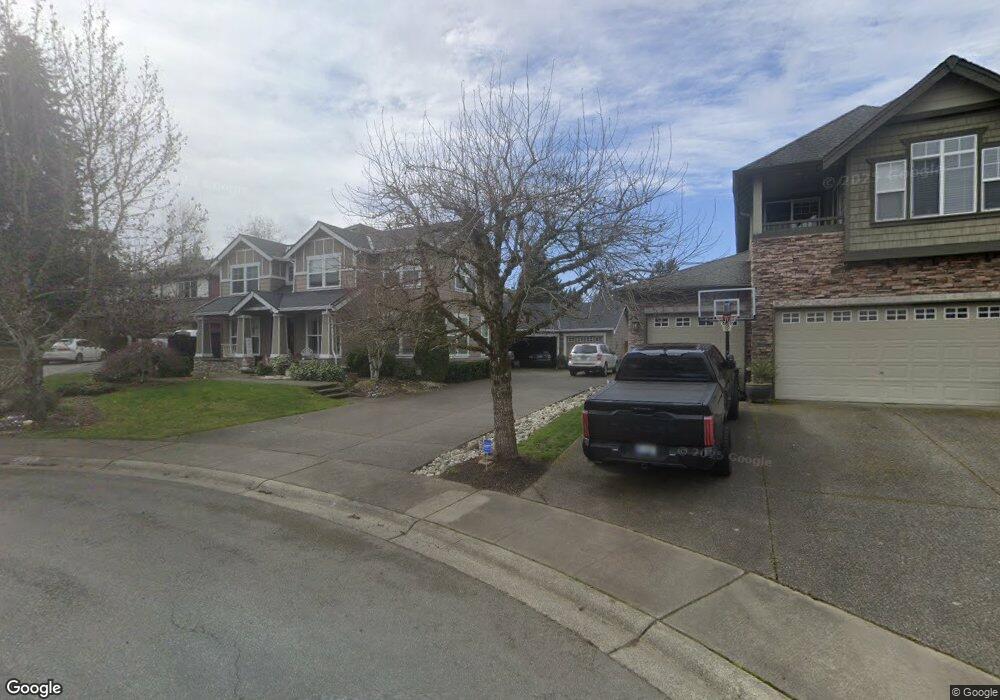
7913 150th St SE Snohomish, WA 98296
Estimated Value: $1,085,000 - $1,266,000
4
Beds
3
Baths
2,865
Sq Ft
$417/Sq Ft
Est. Value
About This Home
This home is located at 7913 150th St SE, Snohomish, WA 98296 and is currently estimated at $1,196,092, approximately $417 per square foot. 7913 150th St SE is a home located in Snohomish County with nearby schools including Little Cedars Elementary School, Valley View Middle School, and Glacier Peak High School.
Ownership History
Date
Name
Owned For
Owner Type
Purchase Details
Closed on
Feb 14, 2008
Sold by
Chavanu Gilbert Jacqueline M and Gilbert Michael
Bought by
Dean Kelvin W and Dean Sandra J
Current Estimated Value
Home Financials for this Owner
Home Financials are based on the most recent Mortgage that was taken out on this home.
Original Mortgage
$335,000
Outstanding Balance
$191,963
Interest Rate
4.37%
Mortgage Type
Purchase Money Mortgage
Estimated Equity
$1,004,129
Purchase Details
Closed on
Apr 25, 2003
Sold by
Gilbert Michael T
Bought by
Chavanu Gilbert Jacqueline M
Home Financials for this Owner
Home Financials are based on the most recent Mortgage that was taken out on this home.
Original Mortgage
$300,400
Interest Rate
4.5%
Create a Home Valuation Report for This Property
The Home Valuation Report is an in-depth analysis detailing your home's value as well as a comparison with similar homes in the area
Home Values in the Area
Average Home Value in this Area
Purchase History
| Date | Buyer | Sale Price | Title Company |
|---|---|---|---|
| Dean Kelvin W | $536,500 | Chicago Title | |
| Chavanu Gilbert Jacqueline M | -- | Chicago Title Insurance Co | |
| Chavanu Gilbert Jacqueline M | $375,505 | Chicago Title Insurance Co |
Source: Public Records
Mortgage History
| Date | Status | Borrower | Loan Amount |
|---|---|---|---|
| Open | Dean Kelvin W | $335,000 | |
| Previous Owner | Chavanu Gilbert Jacqueline M | $300,400 | |
| Closed | Chavanu Gilbert Jacqueline M | $37,550 |
Source: Public Records
Tax History Compared to Growth
Tax History
| Year | Tax Paid | Tax Assessment Tax Assessment Total Assessment is a certain percentage of the fair market value that is determined by local assessors to be the total taxable value of land and additions on the property. | Land | Improvement |
|---|---|---|---|---|
| 2025 | $9,728 | $1,035,400 | $510,000 | $525,400 |
| 2024 | $9,728 | $968,100 | $485,000 | $483,100 |
| 2023 | $9,872 | $1,094,900 | $545,000 | $549,900 |
| 2022 | $8,899 | $791,300 | $319,000 | $472,300 |
| 2020 | $7,621 | $640,300 | $250,000 | $390,300 |
| 2019 | $7,328 | $605,800 | $215,000 | $390,800 |
| 2018 | $8,298 | $571,100 | $195,000 | $376,100 |
| 2017 | $7,285 | $513,700 | $160,000 | $353,700 |
| 2016 | $7,218 | $491,100 | $160,000 | $331,100 |
| 2015 | $7,059 | $461,100 | $140,000 | $321,100 |
| 2013 | $5,767 | $361,400 | $125,000 | $236,400 |
Source: Public Records
Map
Nearby Homes
- 15123 78th Dr SE
- 15329 78th Ave SE
- 15210 75th Ave SE
- 7526 148th Place SE
- 7331 156th St SE
- 8528 152nd St SE
- 14707 87th Ave SE Unit GG7
- 14707 87th Ave SE Unit EE2
- 14707 87th Ave SE Unit DD5
- 14707 87th Ave SE Unit DD4
- 14707 87th Ave SE Unit GG8
- 14707 87th Ave SE Unit DD3
- 14707 87th Ave SE Unit GG5
- 14707 87th Ave SE Unit DD8
- 14707 87th Ave SE Unit DD2
- 14707 87th Ave SE Unit DD1
- 14707 87th Ave SE Unit GG1
- 14707 87th Ave SE Unit GG2
- 14707 87th Ave SE Unit Y6
- 14707 87th Ave SE Unit Y3
- 7910 150th St SE
- 7917 150th St SE
- 7914 150th St SE
- 15113 78th Dr SE
- 7919 150th St SE
- 7918 150th St SE
- 15125 78th Dr SE
- 7925 150th St SE
- 15101 78th Dr SE
- 7922 150th St SE
- 7919 152nd St SE
- 14930 79th Dr SE
- 15029 78th Dr SE
- 15120 78th Dr SE
- 15131 78th Dr SE
- 14928 79th Dr SE
- 15116 78th Dr SE
- 15126 78th Dr SE
- 15108 78th Dr SE
- 15017 78th Dr SE