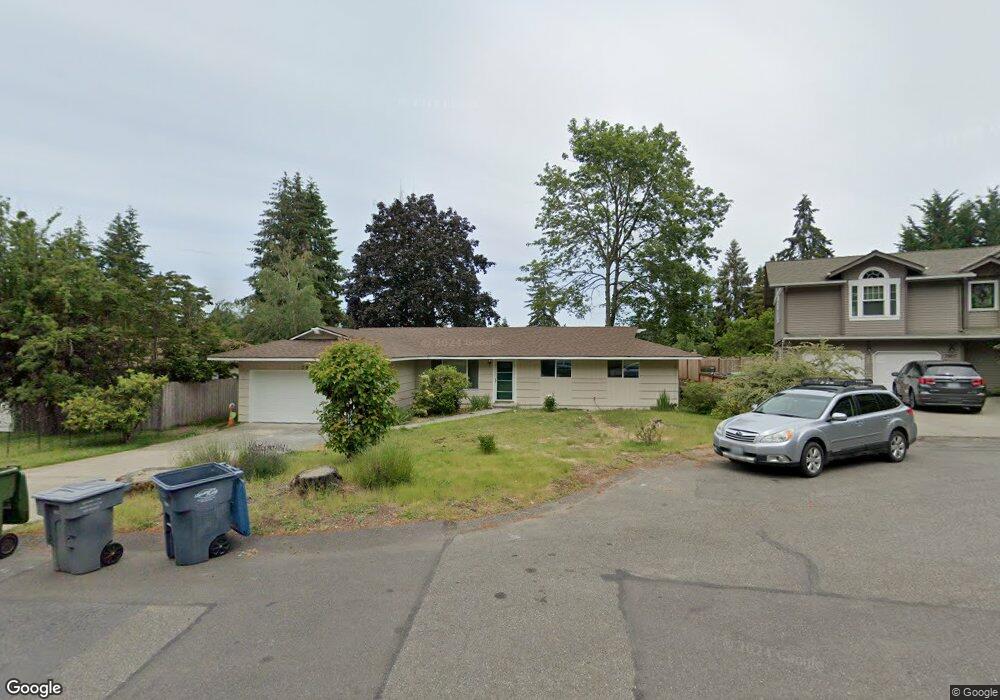
7913 42nd St W University Place, WA 98466
Estimated Value: $595,271 - $724,000
4
Beds
3
Baths
1,837
Sq Ft
$353/Sq Ft
Est. Value
About This Home
This home is located at 7913 42nd St W, University Place, WA 98466 and is currently estimated at $647,818, approximately $352 per square foot. 7913 42nd St W is a home located in Pierce County with nearby schools including Evergreen Primary School, Narrows View Intermediate School, and Curtis Junior High School.
Ownership History
Date
Name
Owned For
Owner Type
Purchase Details
Closed on
Mar 14, 2017
Sold by
Gehring Gerald K and Gehring Rebecca
Bought by
Bowen David Mckell and Bowen Ashley M
Current Estimated Value
Home Financials for this Owner
Home Financials are based on the most recent Mortgage that was taken out on this home.
Original Mortgage
$263,110
Outstanding Balance
$218,185
Interest Rate
4.17%
Mortgage Type
New Conventional
Estimated Equity
$429,633
Purchase Details
Closed on
Jul 15, 2005
Sold by
Kelley Laurence
Bought by
Gehring Gerald K and Gehring Rebecca
Home Financials for this Owner
Home Financials are based on the most recent Mortgage that was taken out on this home.
Original Mortgage
$199,600
Interest Rate
5.51%
Mortgage Type
Fannie Mae Freddie Mac
Purchase Details
Closed on
Mar 10, 2005
Sold by
Winship John R
Bought by
Kelley Laurence
Create a Home Valuation Report for This Property
The Home Valuation Report is an in-depth analysis detailing your home's value as well as a comparison with similar homes in the area
Home Values in the Area
Average Home Value in this Area
Purchase History
| Date | Buyer | Sale Price | Title Company |
|---|---|---|---|
| Bowen David Mckell | $297,019 | Wfg Natl Title | |
| Gehring Gerald K | $249,950 | Rainier Title Company | |
| Kelley Laurence | $201,500 | Multiple |
Source: Public Records
Mortgage History
| Date | Status | Borrower | Loan Amount |
|---|---|---|---|
| Open | Bowen David Mckell | $263,110 | |
| Previous Owner | Gehring Gerald K | $199,600 |
Source: Public Records
Tax History Compared to Growth
Tax History
| Year | Tax Paid | Tax Assessment Tax Assessment Total Assessment is a certain percentage of the fair market value that is determined by local assessors to be the total taxable value of land and additions on the property. | Land | Improvement |
|---|---|---|---|---|
| 2025 | $5,879 | $639,300 | $286,500 | $352,800 |
| 2024 | $5,879 | $500,800 | $275,500 | $225,300 |
| 2023 | $5,879 | $492,000 | $280,900 | $211,100 |
| 2022 | $5,391 | $505,100 | $280,900 | $224,200 |
| 2021 | $4,981 | $356,900 | $190,000 | $166,900 |
| 2019 | $3,957 | $326,800 | $162,800 | $164,000 |
| 2018 | $4,283 | $302,500 | $143,100 | $159,400 |
| 2017 | $3,891 | $270,900 | $121,900 | $149,000 |
| 2016 | $3,642 | $219,400 | $88,600 | $130,800 |
| 2014 | $3,219 | $206,900 | $77,900 | $129,000 |
| 2013 | $3,219 | $184,600 | $70,800 | $113,800 |
Source: Public Records
Map
Nearby Homes
- 8106 -8108 41st Street Ct W
- 8204 42nd St W
- 7612 37th St W Unit D
- 7606 37th St W Unit B3
- 8501 42nd St W
- 4509 74th Avenue Ct W
- 8319 Cirque Dr W Unit 3
- 8323 Cirque Dr W Unit 4
- 4601 73rd Avenue Ct W
- 3510 Oas Dr W
- 8707 45th St W
- 8902 45th St W
- 6910 38th Street Ct W Unit 6910
- 3310 Oas Dr W
- 7905 33rd St W
- 3827 67th Avenue Ct W
- 5217 76th Avenue Ct W
- 3110 Sylvan Dr W
- 8310 52nd Street Ct W
- 8003 53rd Street Ct W
- 7919 42nd St W
- 7907 42nd St W
- 7910 41st St W
- 7916 41st St W Unit 2
- 7916 41st St W Unit 7918
- 7908 7910 41st St W
- 7908 41st St W Unit 7910
- 7908 7910 41st St W
- 7916 18 41st St W
- 7904 42nd Street Ct W
- 7904 42nd St W Unit 7906
- 7912 42nd St W Unit 7914
- 7902 42nd St W
- 4108 80th Ave W
- 4102 80th Ave W
- 4124 80th Ave W
- 7923 41st St W
- 4202 79th Ave W
- 7901 41st St W Unit 7903