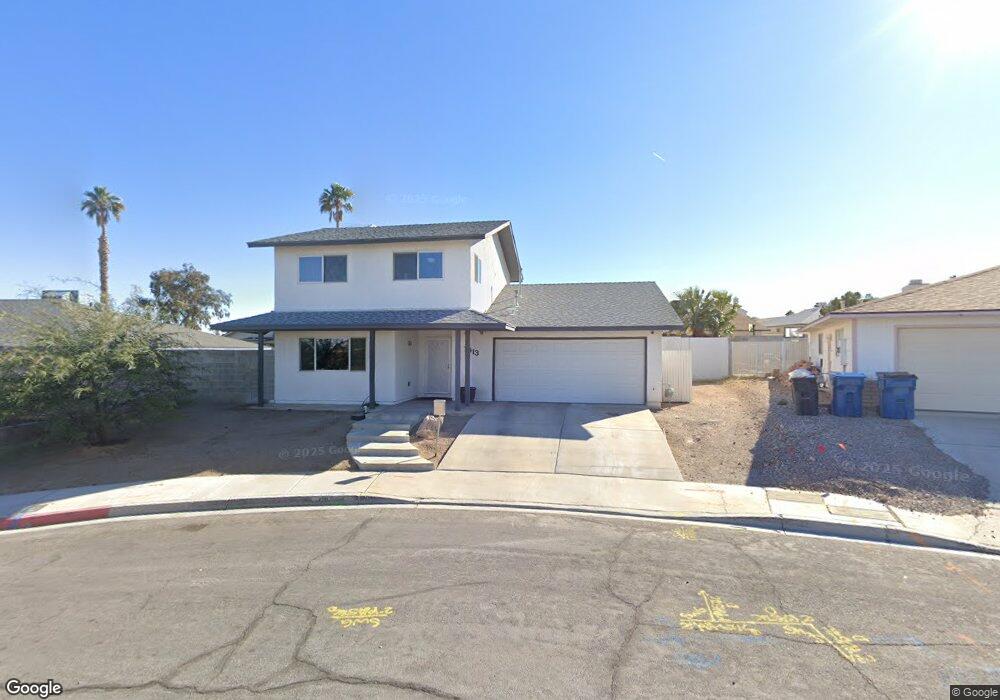
7913 Aplin Ave Las Vegas, NV 89145
Angel Park NeighborhoodEstimated Value: $415,000 - $455,000
4
Beds
2
Baths
1,895
Sq Ft
$227/Sq Ft
Est. Value
About This Home
This home is located at 7913 Aplin Ave, Las Vegas, NV 89145 and is currently estimated at $429,947, approximately $226 per square foot. 7913 Aplin Ave is a home located in Clark County with nearby schools including Walter Jacobson Elementary School, Walter Johnson Junior High School Academy of International Studies, and Bonanza High School.
Ownership History
Date
Name
Owned For
Owner Type
Purchase Details
Closed on
Jul 5, 2019
Sold by
Dunn Keith E
Bought by
Dunn Keith E and Keith E Dunn Revocable Living Trust
Current Estimated Value
Purchase Details
Closed on
Dec 29, 2018
Sold by
Dunn Keith E
Bought by
Dunn Keith E and Keith E Dunn Revocable Living Trust
Purchase Details
Closed on
May 9, 2000
Sold by
Dunn Hansi A
Bought by
Dunn Keith E
Home Financials for this Owner
Home Financials are based on the most recent Mortgage that was taken out on this home.
Original Mortgage
$126,350
Outstanding Balance
$43,902
Interest Rate
8.22%
Mortgage Type
Purchase Money Mortgage
Estimated Equity
$386,045
Purchase Details
Closed on
Feb 1, 2000
Sold by
Thompson William C
Bought by
Ft Mtg Companies and Carl I Brown Mtg
Purchase Details
Closed on
Feb 19, 1998
Sold by
Thompson William C and Thompson Karyl A
Bought by
Thompson William C
Home Financials for this Owner
Home Financials are based on the most recent Mortgage that was taken out on this home.
Original Mortgage
$104,000
Interest Rate
6.9%
Create a Home Valuation Report for This Property
The Home Valuation Report is an in-depth analysis detailing your home's value as well as a comparison with similar homes in the area
Home Values in the Area
Average Home Value in this Area
Purchase History
| Date | Buyer | Sale Price | Title Company |
|---|---|---|---|
| Dunn Keith E | -- | None Available | |
| Dunn Keith E | -- | None Available | |
| Dunn Keith E | -- | Lawyers Title Insurance Corp | |
| Dunn Keith E | $133,000 | Lawyers Title Insurance Corp | |
| Ft Mtg Companies | $111,637 | Fidelity National Title | |
| Thompson William C | -- | Land Title |
Source: Public Records
Mortgage History
| Date | Status | Borrower | Loan Amount |
|---|---|---|---|
| Open | Dunn Keith E | $126,350 | |
| Previous Owner | Thompson William C | $104,000 |
Source: Public Records
Tax History Compared to Growth
Tax History
| Year | Tax Paid | Tax Assessment Tax Assessment Total Assessment is a certain percentage of the fair market value that is determined by local assessors to be the total taxable value of land and additions on the property. | Land | Improvement |
|---|---|---|---|---|
| 2025 | $1,351 | $73,170 | $35,700 | $37,470 |
| 2024 | $1,312 | $73,170 | $35,700 | $37,470 |
| 2023 | $1,312 | $70,964 | $33,950 | $37,014 |
| 2022 | $1,274 | $61,126 | $26,600 | $34,526 |
| 2021 | $1,237 | $57,597 | $24,150 | $33,447 |
| 2020 | $1,198 | $57,713 | $23,800 | $33,913 |
| 2019 | $1,163 | $53,529 | $19,600 | $33,929 |
| 2018 | $1,129 | $51,550 | $18,550 | $33,000 |
| 2017 | $1,607 | $49,022 | $15,050 | $33,972 |
| 2016 | $1,605 | $47,357 | $11,900 | $35,457 |
| 2015 | $1,055 | $45,991 | $10,500 | $35,491 |
| 2014 | $1,024 | $36,073 | $6,475 | $29,598 |
Source: Public Records
Map
Nearby Homes
- 7716 Ducharme Ave
- 105 S Cimarron Rd
- 425 Cherry Meadows Ct
- 212 Bradshaw Way
- 7873 Mount Whitney Cir
- 7700 Tomich Ave
- 328 S Buffalo Dr Unit 101
- 338 Jett St Unit 101
- 8204 Charles Turk Dr
- 8229 Ducharme Ave
- 120 Firestone Dr
- 7912 Foxwood Place Unit 104
- 8229 Willeta Ave
- 8233 Ducharme Ave
- 7830 Foxwood Place Unit 6011
- 213 N Cimarron Rd Unit 17
- 613 Yacht Harbor Dr Unit 1111
- 104 Hutton Ln
- 605 Devonhall St Unit 201
- 605 Devonhall St Unit 202
- 7909 Aplin Ave
- 220 Sedran Place
- 7912 Ducharme Ave
- 7916 Ducharme Ave
- 7908 Ducharme Ave
- 7905 Aplin Ave
- 216 Sedran Place
- 7920 Ducharme Ave
- 213 Sedran Place
- 7904 Ducharme Ave
- 212 Sedran Place
- 7901 Aplin Ave
- 221 Veeder Dr
- 225 Veeder Dr
- 225 Veeder Dr Unit 9999
- 225 Veeder Dr Unit 999
- 212 Tighe Way
- 217 Veeder Dr
- 7900 Ducharme Ave
- 209 Sedran Place