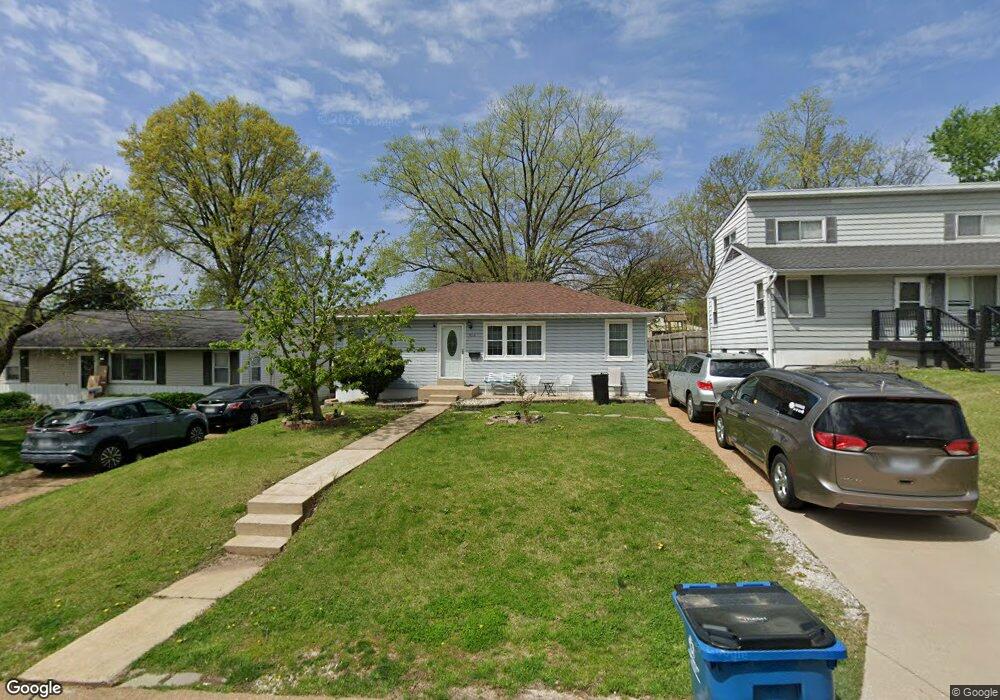
7913 Harlan Ave Saint Louis, MO 63123
Estimated Value: $167,000 - $205,000
3
Beds
1
Bath
888
Sq Ft
$212/Sq Ft
Est. Value
About This Home
This home is located at 7913 Harlan Ave, Saint Louis, MO 63123 and is currently estimated at $187,964, approximately $211 per square foot. 7913 Harlan Ave is a home located in St. Louis County with nearby schools including Mesnier Primary School, Gotsch Intermediate School, and Rogers Middle School.
Ownership History
Date
Name
Owned For
Owner Type
Purchase Details
Closed on
Nov 14, 2002
Sold by
Bayne Ann M and Bayne David L
Bought by
Baban Salar and Baban Begard
Current Estimated Value
Home Financials for this Owner
Home Financials are based on the most recent Mortgage that was taken out on this home.
Original Mortgage
$99,114
Outstanding Balance
$41,117
Interest Rate
5.89%
Mortgage Type
FHA
Estimated Equity
$146,847
Purchase Details
Closed on
Nov 12, 2002
Sold by
Reed George B and Reed Suzanne
Bought by
Owens Gary D and Fritschle Lisa A
Home Financials for this Owner
Home Financials are based on the most recent Mortgage that was taken out on this home.
Original Mortgage
$99,114
Outstanding Balance
$41,117
Interest Rate
5.89%
Mortgage Type
FHA
Estimated Equity
$146,847
Purchase Details
Closed on
Feb 22, 2001
Sold by
Willenburg Ann M and Lee David
Bought by
Bayne Ann M
Home Financials for this Owner
Home Financials are based on the most recent Mortgage that was taken out on this home.
Original Mortgage
$68,500
Interest Rate
7.19%
Create a Home Valuation Report for This Property
The Home Valuation Report is an in-depth analysis detailing your home's value as well as a comparison with similar homes in the area
Home Values in the Area
Average Home Value in this Area
Purchase History
| Date | Buyer | Sale Price | Title Company |
|---|---|---|---|
| Baban Salar | $108,500 | -- | |
| Owens Gary D | -- | -- | |
| Bayne Ann M | -- | -- |
Source: Public Records
Mortgage History
| Date | Status | Borrower | Loan Amount |
|---|---|---|---|
| Open | Baban Salar | $99,114 | |
| Previous Owner | Bayne Ann M | $68,500 |
Source: Public Records
Tax History Compared to Growth
Tax History
| Year | Tax Paid | Tax Assessment Tax Assessment Total Assessment is a certain percentage of the fair market value that is determined by local assessors to be the total taxable value of land and additions on the property. | Land | Improvement |
|---|---|---|---|---|
| 2025 | $2,299 | $35,960 | $14,740 | $21,220 |
| 2024 | $2,299 | $28,420 | $9,840 | $18,580 |
| 2023 | $2,223 | $28,420 | $9,840 | $18,580 |
| 2022 | $2,210 | $25,740 | $9,840 | $15,900 |
| 2021 | $2,159 | $25,740 | $9,840 | $15,900 |
| 2020 | $1,988 | $22,100 | $9,670 | $12,430 |
| 2019 | $1,984 | $22,100 | $9,670 | $12,430 |
| 2018 | $1,936 | $19,060 | $6,750 | $12,310 |
| 2017 | $1,925 | $19,060 | $6,750 | $12,310 |
| 2016 | $1,516 | $15,910 | $3,900 | $12,010 |
| 2015 | $1,524 | $15,910 | $3,900 | $12,010 |
| 2014 | -- | $18,830 | $4,670 | $14,160 |
Source: Public Records
Map
Nearby Homes
- 8022 Joel Ave
- 8032 Joel Ave
- 8029 Joel Ave
- 7908 Fleta St
- 5900 Apple Valley Dr
- 8019 Gramond Dr
- 7743 Genesta St
- 5615 Willard Ave
- 5309 Staely Ave
- 7917 Menola St
- 8211 Mathilda Ave
- 5237 Heege Rd
- 5331 Vine Ave
- 8027 McGee St
- 5311 Vine Ave
- 7817 Clevedon St
- 8305 Vasel Dr
- 8315 Maylor Dr
- 8348 Vasel Dr
- 5800 Langley Ave
- 7909 Harlan Ave
- 7917 Harlan Ave
- 7903 Harlan Ave
- 7921 Harlan Ave
- 7914 Ivanhoe St
- 7918 Ivanhoe St
- 7925 Harlan Ave
- 7910 Ivanhoe St
- 7901 Harlan Ave
- 7922 Ivanhoe St
- 7906 Ivanhoe St
- 7912 Harlan Ave
- 7929 Harlan Ave
- 7908 Harlan Ave
- 7916 Harlan Ave
- 7904 Harlan Ave
- 7902 Ivanhoe St
- 7930 Ivanhoe St
- 7841 Harlan Ave
- 7924 Harlan Ave