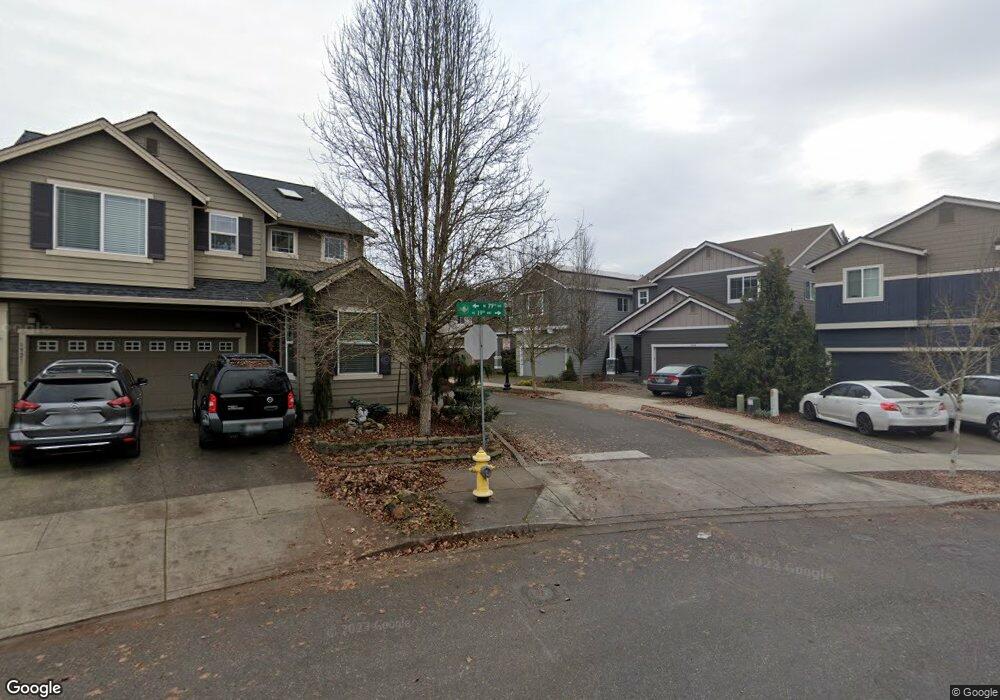
7913 NE 19th Cir Vancouver, WA 98664
Ogden NeighborhoodEstimated Value: $489,000 - $547,504
4
Beds
3
Baths
1,971
Sq Ft
$264/Sq Ft
Est. Value
About This Home
This home is located at 7913 NE 19th Cir, Vancouver, WA 98664 and is currently estimated at $520,626, approximately $264 per square foot. 7913 NE 19th Cir is a home located in Clark County with nearby schools including Peter S. Ogden Elementary School, McLoughlin Middle School, and Fort Vancouver High School.
Ownership History
Date
Name
Owned For
Owner Type
Purchase Details
Closed on
Apr 12, 2016
Sold by
Hood Joshua Allen and Hood Misty White
Bought by
Danny Jeremy
Current Estimated Value
Home Financials for this Owner
Home Financials are based on the most recent Mortgage that was taken out on this home.
Original Mortgage
$277,209
Outstanding Balance
$219,936
Interest Rate
3.64%
Mortgage Type
New Conventional
Estimated Equity
$300,690
Purchase Details
Closed on
Jan 17, 2014
Sold by
D R Horton Inc Portland
Bought by
Hood Joshua Allen
Home Financials for this Owner
Home Financials are based on the most recent Mortgage that was taken out on this home.
Original Mortgage
$225,834
Interest Rate
3.75%
Mortgage Type
FHA
Purchase Details
Closed on
Jun 5, 2013
Sold by
Belmont Associates Llc
Bought by
D R Horton Inc Portland
Purchase Details
Closed on
Jun 27, 2011
Sold by
Riverside Homes Llc
Bought by
Belmont Associates Llc
Create a Home Valuation Report for This Property
The Home Valuation Report is an in-depth analysis detailing your home's value as well as a comparison with similar homes in the area
Home Values in the Area
Average Home Value in this Area
Purchase History
| Date | Buyer | Sale Price | Title Company |
|---|---|---|---|
| Danny Jeremy | $279,400 | Columbia Title Agency | |
| Hood Joshua Allen | $230,000 | Chicago Title Insurance | |
| D R Horton Inc Portland | $1,050,000 | First American Title | |
| Belmont Associates Llc | $1,601,000 | Chicago Title Insurance |
Source: Public Records
Mortgage History
| Date | Status | Borrower | Loan Amount |
|---|---|---|---|
| Open | Danny Jeremy | $277,209 | |
| Previous Owner | Hood Joshua Allen | $225,834 |
Source: Public Records
Tax History Compared to Growth
Tax History
| Year | Tax Paid | Tax Assessment Tax Assessment Total Assessment is a certain percentage of the fair market value that is determined by local assessors to be the total taxable value of land and additions on the property. | Land | Improvement |
|---|---|---|---|---|
| 2025 | $5,053 | $499,283 | $156,750 | $342,533 |
| 2024 | $4,493 | $517,461 | $156,750 | $360,711 |
| 2023 | $4,256 | $480,343 | $156,750 | $323,593 |
| 2022 | $3,944 | $456,705 | $156,750 | $299,955 |
| 2021 | $3,741 | $394,361 | $135,500 | $258,861 |
| 2020 | $3,371 | $352,472 | $98,000 | $254,472 |
| 2019 | $3,135 | $329,100 | $87,000 | $242,100 |
| 2018 | $3,416 | $317,098 | $0 | $0 |
| 2017 | $3,024 | $286,823 | $0 | $0 |
| 2016 | $2,899 | $265,022 | $0 | $0 |
| 2015 | $2,643 | $242,763 | $0 | $0 |
| 2014 | -- | $209,255 | $0 | $0 |
| 2013 | -- | $40,400 | $0 | $0 |
Source: Public Records
Map
Nearby Homes
- 7905 NE 19th Cir
- 8107 NE 20th St Unit 17
- 1918 NE 77th Place
- 7632 NE 20th St
- 2312 NE 79th Ave
- 2112 NE 79th Ave Unit H103
- 2402 NE 79th Ct Unit AE13
- 2123 NE 77th Ave Unit AQ64
- 2401 NE 77th Ave Unit AL23
- 8009 NE 16th St
- 8212 NE Snowberry Loop
- 2016 NE 87th Ave
- 8503 NE 25th St
- 8702 NE 17th St Unit 61
- 8803 NE 14th St
- 1007 NE 82nd Ave
- 3012 NE Littler Way
- 1604 NE 91st Ave
- 8405 NE 10th St
- 1411 NE 90th Ave
- 7909 NE 19th Cir Unit BP34
- 1921 NE 79th Ave
- 7917 NE 19th Cir
- 7827 NE 19th Way Unit LOT32
- 7921 NE 19th Cir
- 1925 NE 79th Ave
- 7925 NE 19th Cir
- 7919 NE 20th St
- 1929 NE 79th Ave
- 7923 NE 20th St
- 7903 NE 20th St
- 7826 NE 19th Way
- 7915 NE 20th St
- 7927 NE 20th St
- 7822 NE 19th Way
- 7907 NE 20th St
- 8001 NE 20th St
- 7816 NE 19th Way
- 7819 NE 20th St
- 1928 NE 79th Ave