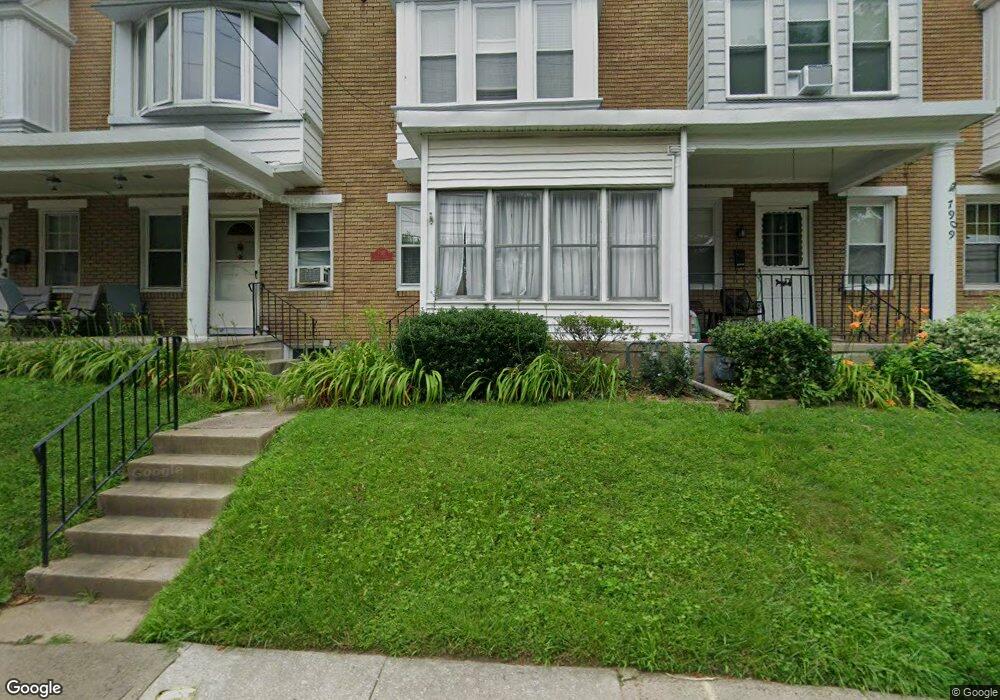
7913 Queen St Glenside, PA 19038
Estimated Value: $284,000 - $392,000
3
Beds
1
Bath
1,240
Sq Ft
$272/Sq Ft
Est. Value
About This Home
This home is located at 7913 Queen St, Glenside, PA 19038 and is currently estimated at $337,110, approximately $271 per square foot. 7913 Queen St is a home located in Montgomery County with nearby schools including Enfield Elementary School, Erdenheim Elementary School, and Springfield Township Middle School.
Ownership History
Date
Name
Owned For
Owner Type
Purchase Details
Closed on
Aug 16, 2013
Sold by
Vanhaute Paul
Bought by
Vanhaute Paul and Van Haute Marie A
Current Estimated Value
Home Financials for this Owner
Home Financials are based on the most recent Mortgage that was taken out on this home.
Original Mortgage
$146,250
Outstanding Balance
$108,413
Interest Rate
4.31%
Mortgage Type
New Conventional
Estimated Equity
$228,697
Purchase Details
Closed on
Sep 9, 2004
Sold by
Faino Kimberly A
Bought by
Vanvanhaute Paul Van
Purchase Details
Closed on
Jul 27, 1999
Sold by
Smith Andrew B
Bought by
Faino Kimberly A
Purchase Details
Closed on
Feb 12, 1997
Sold by
Morrow William and Morrow John F
Bought by
Smith Andrew B
Create a Home Valuation Report for This Property
The Home Valuation Report is an in-depth analysis detailing your home's value as well as a comparison with similar homes in the area
Home Values in the Area
Average Home Value in this Area
Purchase History
| Date | Buyer | Sale Price | Title Company |
|---|---|---|---|
| Vanhaute Paul | -- | First American Title Ins Co | |
| Vanvanhaute Paul Van | $127,500 | -- | |
| Faino Kimberly A | $89,500 | -- | |
| Smith Andrew B | $47,000 | -- |
Source: Public Records
Mortgage History
| Date | Status | Borrower | Loan Amount |
|---|---|---|---|
| Open | Vanhaute Paul | $146,250 | |
| Closed | Vanvanhaute Paul Van | $0 |
Source: Public Records
Tax History
| Year | Tax Paid | Tax Assessment Tax Assessment Total Assessment is a certain percentage of the fair market value that is determined by local assessors to be the total taxable value of land and additions on the property. | Land | Improvement |
|---|---|---|---|---|
| 2025 | $4,357 | $92,490 | $44,060 | $48,430 |
| 2024 | $4,357 | $92,490 | $44,060 | $48,430 |
| 2023 | $4,205 | $92,490 | $44,060 | $48,430 |
| 2022 | $4,084 | $92,490 | $44,060 | $48,430 |
| 2021 | $3,978 | $92,490 | $44,060 | $48,430 |
| 2020 | $3,885 | $92,490 | $44,060 | $48,430 |
| 2019 | $3,825 | $92,490 | $44,060 | $48,430 |
Source: Public Records
Map
Nearby Homes
- 1106 E Pleasant Ave
- 1118 E Willow Grove Ave
- 0 Campbell Ln
- 7846 Flourtown Ave
- 8303 Hull Dr
- 8650 Provident St
- 1612 E Willow Grove Ave
- 8102 Eastern Ave
- 8648 Rugby St
- 8546 Forrest Ave
- 1629 Murdoch Rd
- 8502 Temple Rd
- 8444 Bayard St
- 8429 Michener Ave
- 1621 E Gowen Ave
- 8427 Thouron Ave
- 8326 Temple Rd
- 8550 Trumbauer Dr Unit L35
- 8327 Forrest Ave
- 8307 Thouron Ave
- 7915 Queen St
- 7917 Queen St Unit 4
- 7911 Queen St
- 7909 Queen St
- 7907 Queen St
- 1110 E Willow Grove Ave
- 7905 Queen St
- 7903 Queen St
- 1025 E Pleasant St
- 1102 E Willow Grove Ave
- 1027 E Pleasant St
- 7901 Queen St
- 1029 E Pleasant St Unit 14
- 7920 Queen St
- 1031 E Pleasant St
- 1023 E Pleasant St
- 1033 E Pleasant St
- 1118 E Willow Grove Ave
- Lot 3 E Pleasant Ave
- 0 E Pleasant Ave
Your Personal Tour Guide
Ask me questions while you tour the home.