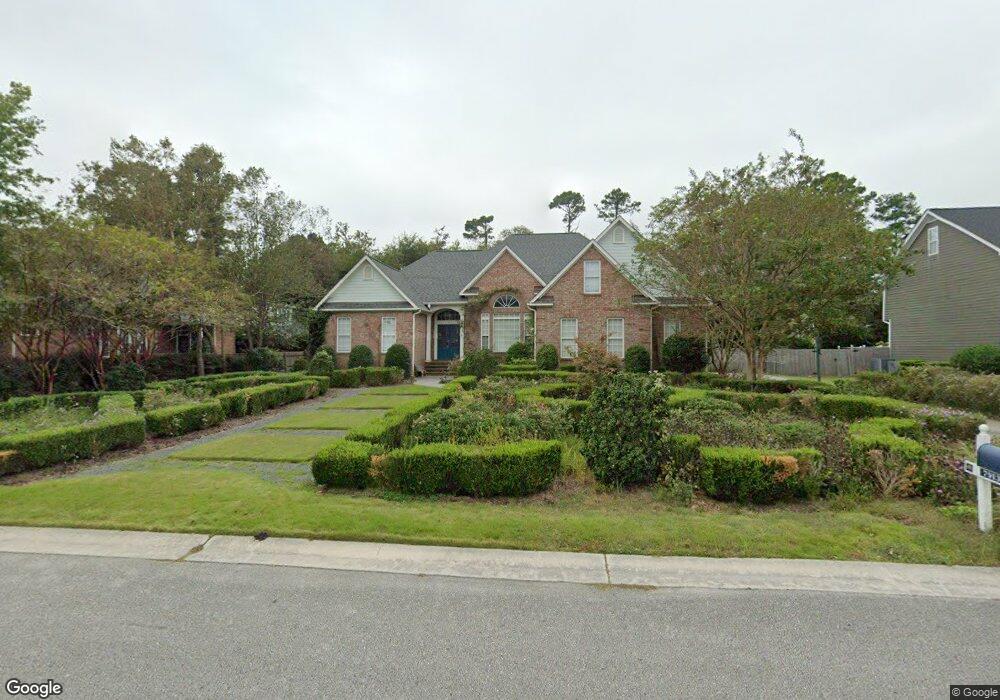
7913 Sanderling Place Wilmington, NC 28411
Estimated Value: $906,000 - $985,000
4
Beds
4
Baths
3,717
Sq Ft
$251/Sq Ft
Est. Value
About This Home
This home is located at 7913 Sanderling Place, Wilmington, NC 28411 and is currently estimated at $932,265, approximately $250 per square foot. 7913 Sanderling Place is a home located in New Hanover County with nearby schools including Porters Neck Elementary School, Holly Shelter Middle School, and Emsley A. Laney High School.
Ownership History
Date
Name
Owned For
Owner Type
Purchase Details
Closed on
Aug 3, 2022
Sold by
Gregg Neilson Douglas
Bought by
Douglas Gregg Neilson Revocable Trust
Current Estimated Value
Purchase Details
Closed on
Aug 30, 2001
Sold by
Evans Connie Fussell
Bought by
Neilson Douglas G Karen Record
Purchase Details
Closed on
May 15, 2001
Sold by
Shanklin Kenneth A Sub Trustee
Bought by
Evans Connie Fussell
Purchase Details
Closed on
Aug 1, 1997
Sold by
Bayshore Estates Inc
Bought by
Morgan Home Builders Inc
Purchase Details
Closed on
Mar 8, 1993
Sold by
Bayshore Estates Inc
Bought by
Nc Dept Of Transportation
Purchase Details
Closed on
May 1, 1961
Bought by
Bayshore Estates Inc
Create a Home Valuation Report for This Property
The Home Valuation Report is an in-depth analysis detailing your home's value as well as a comparison with similar homes in the area
Home Values in the Area
Average Home Value in this Area
Purchase History
| Date | Buyer | Sale Price | Title Company |
|---|---|---|---|
| Douglas Gregg Neilson Revocable Trust | -- | None Listed On Document | |
| Neilson Douglas G Karen Record | $374,000 | -- | |
| Evans Connie Fussell | -- | -- | |
| Morgan Home Builders Inc | $40,000 | -- | |
| Nc Dept Of Transportation | -- | -- | |
| Bayshore Estates Inc | -- | -- |
Source: Public Records
Tax History Compared to Growth
Tax History
| Year | Tax Paid | Tax Assessment Tax Assessment Total Assessment is a certain percentage of the fair market value that is determined by local assessors to be the total taxable value of land and additions on the property. | Land | Improvement |
|---|---|---|---|---|
| 2024 | $3,057 | $571,000 | $135,700 | $435,300 |
| 2023 | $3,051 | $571,000 | $135,700 | $435,300 |
| 2022 | $3,080 | $571,000 | $135,700 | $435,300 |
| 2021 | $3,138 | $571,000 | $135,700 | $435,300 |
| 2020 | $2,956 | $467,300 | $93,200 | $374,100 |
| 2019 | $2,956 | $467,300 | $93,200 | $374,100 |
| 2018 | $2,956 | $467,300 | $93,200 | $374,100 |
| 2017 | $3,026 | $467,300 | $93,200 | $374,100 |
| 2016 | $2,956 | $426,600 | $93,200 | $333,400 |
| 2015 | $2,747 | $426,600 | $93,200 | $333,400 |
| 2014 | $2,700 | $426,600 | $93,200 | $333,400 |
Source: Public Records
Map
Nearby Homes
- 7907 Beaufort Ct
- 602 Southerland Farm Dr
- 208 Country Haven Dr Unit A
- 208 Country Haven Dr Unit B
- 208 Country Haven Dr Unit B
- 208 Country Haven Dr Unit A
- 7843 Raintree
- 607 Trace Dr
- 7834 Olde Pond Rd
- 660 Vale Dr
- 633 Vale Dr
- 7846 Olde Pond Rd
- 629 Vale Dr
- 133 Graystone Rd
- 546 Aquarius Dr
- 7926 Cumberland Place
- 8133 Porters Crossing Way
- 161 Graystone Rd
- 430 Upland Dr
- 8238 Porters Crossing Way
- 7904 Tarrants Ct
- 7909 Sanderling Place
- 7905 Sanderling Place
- 7902 Tarrants Ct
- 7912 Sanderling Place Unit LT34R
- 7908 Sanderling Place
- 7900 Tarrants Ct
- 7904 Sanderling Place
- 7901 Sanderling Place
- 7901 Tarrants Ct
- 7916 Sanderling Place
- 7900 Sanderling Place
- 7915 Sandeling Place
- 102 Koonce Ct
- 7915 Sanderling Place
- 104 Koonce Ct
- 7920 Sanderling Place
- 205 Marsh Oaks Dr
- 7821 Marymount Dr
- 7817 Marymount Dr