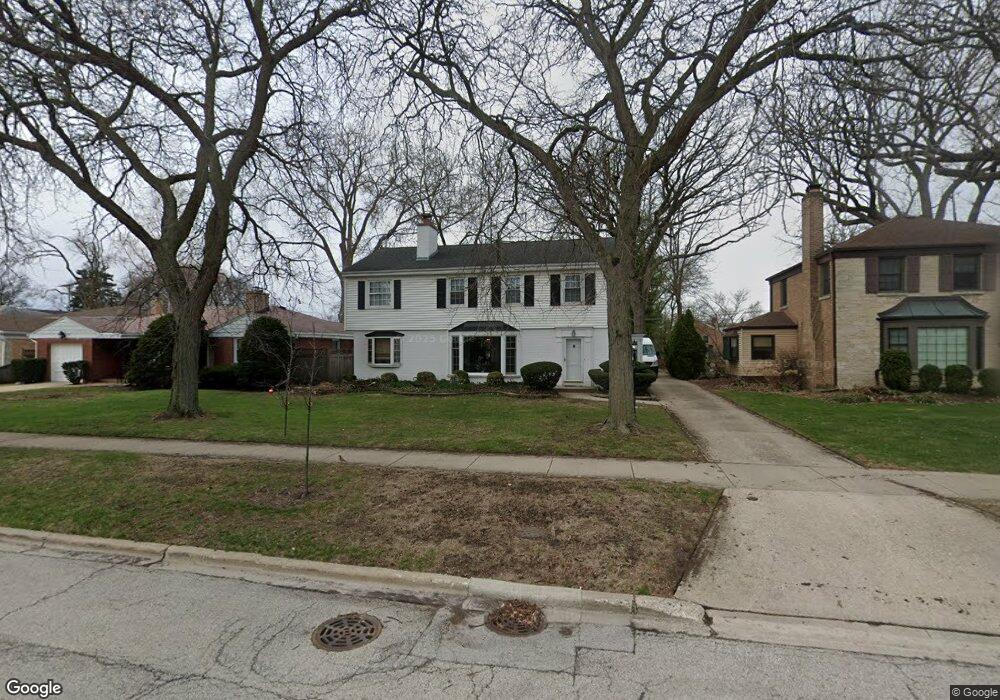
7914 Long Ave Morton Grove, IL 60053
Southwest Skokie NeighborhoodEstimated Value: $535,000 - $628,000
3
Beds
2
Baths
2,308
Sq Ft
$246/Sq Ft
Est. Value
About This Home
This home is located at 7914 Long Ave, Morton Grove, IL 60053 and is currently estimated at $567,263, approximately $245 per square foot. 7914 Long Ave is a home located in Cook County with nearby schools including Madison Elementary School, Thomas Edison Elementary School, and Lincoln Junior High School.
Ownership History
Date
Name
Owned For
Owner Type
Purchase Details
Closed on
Mar 16, 2015
Sold by
Fannie Mae
Bought by
Hall Kathleen Murai and Kawako Ronald M
Current Estimated Value
Purchase Details
Closed on
Jun 4, 2014
Sold by
Shrestha Anjaya and Shrestha Sangita Jha
Bought by
Federal National Mortgage Association
Purchase Details
Closed on
Mar 19, 2008
Sold by
Gordon Robert T and Gordon Linda A
Bought by
Shrestha Sangita Jha and Shrestha Anjaya
Home Financials for this Owner
Home Financials are based on the most recent Mortgage that was taken out on this home.
Original Mortgage
$415,800
Interest Rate
5.79%
Mortgage Type
Unknown
Purchase Details
Closed on
May 15, 2003
Sold by
Kirchens Bernard P and Kirchens Joycelynn
Bought by
Gordon Robert T and Gordon Linda A
Home Financials for this Owner
Home Financials are based on the most recent Mortgage that was taken out on this home.
Original Mortgage
$322,700
Interest Rate
5.88%
Mortgage Type
Balloon
Create a Home Valuation Report for This Property
The Home Valuation Report is an in-depth analysis detailing your home's value as well as a comparison with similar homes in the area
Home Values in the Area
Average Home Value in this Area
Purchase History
| Date | Buyer | Sale Price | Title Company |
|---|---|---|---|
| Hall Kathleen Murai | -- | Ct | |
| Federal National Mortgage Association | -- | None Available | |
| Shrestha Sangita Jha | $462,000 | Pntn | |
| Gordon Robert T | -- | Pntn | |
| Gordon Robert T | -- | Pntn |
Source: Public Records
Mortgage History
| Date | Status | Borrower | Loan Amount |
|---|---|---|---|
| Previous Owner | Shrestha Sangita Jha | $415,800 | |
| Previous Owner | Gordon Robert T | $322,700 |
Source: Public Records
Tax History Compared to Growth
Tax History
| Year | Tax Paid | Tax Assessment Tax Assessment Total Assessment is a certain percentage of the fair market value that is determined by local assessors to be the total taxable value of land and additions on the property. | Land | Improvement |
|---|---|---|---|---|
| 2024 | $6,230 | $20,546 | $4,875 | $15,671 |
| 2023 | $6,144 | $20,546 | $4,875 | $15,671 |
| 2022 | $6,144 | $20,546 | $4,875 | $15,671 |
| 2021 | $6,734 | $19,430 | $3,000 | $16,430 |
| 2020 | $6,707 | $19,430 | $3,000 | $16,430 |
| 2019 | $6,751 | $21,832 | $3,000 | $18,832 |
| 2018 | $6,707 | $19,589 | $2,718 | $16,871 |
| 2017 | $6,732 | $19,589 | $2,718 | $16,871 |
| 2016 | $6,477 | $19,589 | $2,718 | $16,871 |
| 2015 | $5,849 | $17,002 | $2,343 | $14,659 |
| 2014 | $5,743 | $17,002 | $2,343 | $14,659 |
| 2013 | $5,760 | $17,002 | $2,343 | $14,659 |
Source: Public Records
Map
Nearby Homes
- 5505 Oakton St
- 5501 Mulford St
- 5251 Galitz St Unit 410
- 5251 Galitz St Unit 311
- 5261 Mulford St
- 5500 Harvard Terrace
- 5207 Galitz St
- 8128 Laramie Ave
- 7848 Lincoln Ave
- 5153 Dobson St
- 5148 Cleveland St
- 4953 Oakton St Unit 510
- 4953 Oakton St Unit P11
- 4953 Oakton St Unit 207
- 7748 Lincoln Ave
- 7507 Frontage Rd
- 5000 Oakton St Unit 505
- 7500 Laramie Ave
- 8306 Central Ave
- 4906 Hull St