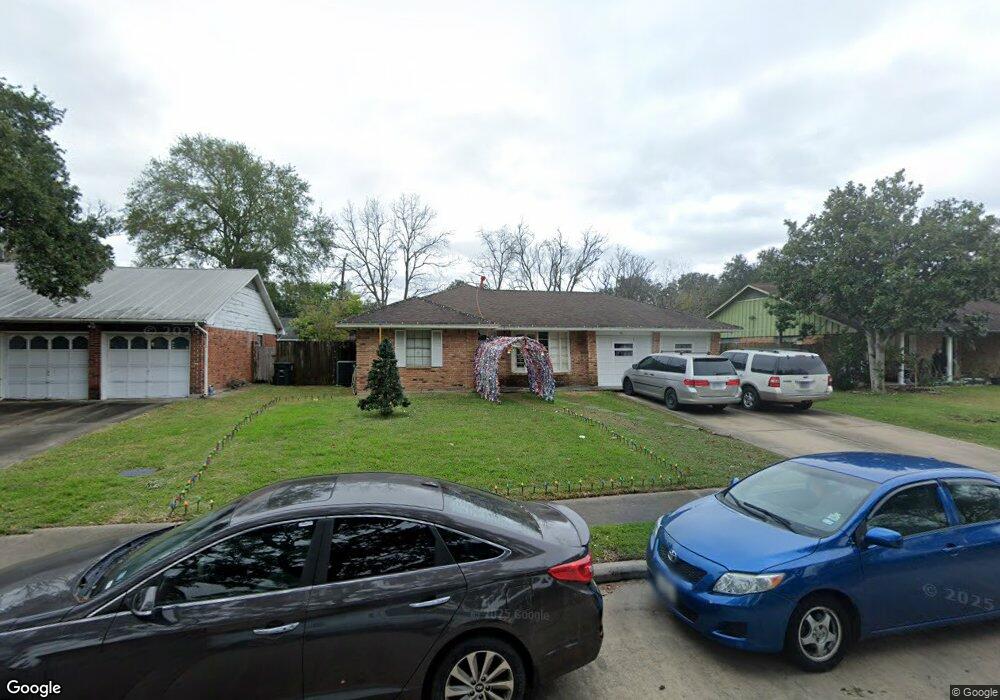
7915 Leader St Houston, TX 77036
Sharpstown NeighborhoodEstimated Value: $263,000 - $303,000
4
Beds
2
Baths
1,950
Sq Ft
$147/Sq Ft
Est. Value
About This Home
This home is located at 7915 Leader St, Houston, TX 77036 and is currently estimated at $286,797, approximately $147 per square foot. 7915 Leader St is a home located in Harris County with nearby schools including Neff Elementary School, Sugar Grove Academy, and Sharpstown High School.
Ownership History
Date
Name
Owned For
Owner Type
Purchase Details
Closed on
Jul 14, 2017
Sold by
Lang Benjamin Nguyen Investments Inc
Bought by
Lobaina Yileysi Chaovin and Sanjurjo Daniel Barriel
Current Estimated Value
Home Financials for this Owner
Home Financials are based on the most recent Mortgage that was taken out on this home.
Original Mortgage
$201,286
Outstanding Balance
$167,143
Interest Rate
3.87%
Mortgage Type
FHA
Estimated Equity
$119,654
Purchase Details
Closed on
Dec 19, 2016
Sold by
Pham Trong V and Tram Diep N
Bought by
Lagn Benjamin Nguyen Investmens Inc
Purchase Details
Closed on
May 24, 2004
Sold by
Ellis Mark A and Ellis Victoria R
Bought by
Pham Trong
Home Financials for this Owner
Home Financials are based on the most recent Mortgage that was taken out on this home.
Original Mortgage
$99,300
Interest Rate
5.93%
Mortgage Type
Purchase Money Mortgage
Create a Home Valuation Report for This Property
The Home Valuation Report is an in-depth analysis detailing your home's value as well as a comparison with similar homes in the area
Home Values in the Area
Average Home Value in this Area
Purchase History
| Date | Buyer | Sale Price | Title Company |
|---|---|---|---|
| Lobaina Yileysi Chaovin | -- | None Available | |
| Lagn Benjamin Nguyen Investmens Inc | -- | None Available | |
| Pham Trong | -- | Chicago Title Insurance Co |
Source: Public Records
Mortgage History
| Date | Status | Borrower | Loan Amount |
|---|---|---|---|
| Open | Lobaina Yileysi Chaovin | $201,286 | |
| Previous Owner | Pham Trong | $99,300 |
Source: Public Records
Tax History Compared to Growth
Tax History
| Year | Tax Paid | Tax Assessment Tax Assessment Total Assessment is a certain percentage of the fair market value that is determined by local assessors to be the total taxable value of land and additions on the property. | Land | Improvement |
|---|---|---|---|---|
| 2025 | $3,513 | $281,527 | $136,930 | $144,597 |
| 2024 | $3,513 | $265,958 | $98,894 | $167,064 |
| 2023 | $3,513 | $269,051 | $98,894 | $170,157 |
| 2022 | $4,928 | $237,983 | $60,858 | $177,125 |
| 2021 | $4,576 | $196,330 | $60,858 | $135,472 |
| 2020 | $5,012 | $200,353 | $60,858 | $139,495 |
| 2019 | $5,178 | $198,374 | $45,643 | $152,731 |
| 2018 | $3,567 | $190,158 | $45,643 | $144,515 |
| 2017 | $4,835 | $185,338 | $45,643 | $139,695 |
| 2016 | $3,865 | $177,991 | $45,643 | $132,348 |
| 2015 | $2,352 | $159,331 | $45,643 | $113,688 |
| 2014 | $2,352 | $137,210 | $45,643 | $91,567 |
Source: Public Records
Map
Nearby Homes
- 7819 Bellaire Blvd
- 8314 Edgemoor Dr
- 6602 Harbor Town Dr Unit 1207
- 6602 Harbor Town Dr Unit 1202
- 6500 Harbor Town Dr Unit 3208
- 6500 Harbor Town Dr Unit 2808
- 6500 Harbor Town Dr Unit 3204
- 6500 Harbor Town Dr Unit 3408
- 6500 Harbor Town Dr Unit 2902
- 8019 Sharpview Dr
- 8223 Golf Green Cir
- 7419 Barberton Dr
- 6403 Fondren Rd Unit D25
- 8515 Edgemoor Dr
- 8527 Edgemoor Dr
- 7807 Bellerive Dr
- 7655 Bellerive Dr Unit 3
- 8530 Roos Rd
- 7302 Burning Tree Dr
- 8153 Sands Point Dr Unit 115
- 7911 Leader St
- 7919 Leader St
- 7914 Edgemoor Dr
- 7910 Edgemoor Dr
- 7918 Edgemoor Dr
- 7907 Leader St
- 8003 Leader St
- 7914 Leader St
- 7906 Edgemoor Dr
- 8002 Edgemoor Dr
- 7910 Leader St
- 7918 Leader St
- 8007 Leader St
- 7903 Leader St
- 7906 Leader St
- 8002 Leader St
- 7902 Edgemoor Dr
- 7902 Edgemoor Dr Unit 1
- 8006 Edgemoor Dr
- 8006 Leader St