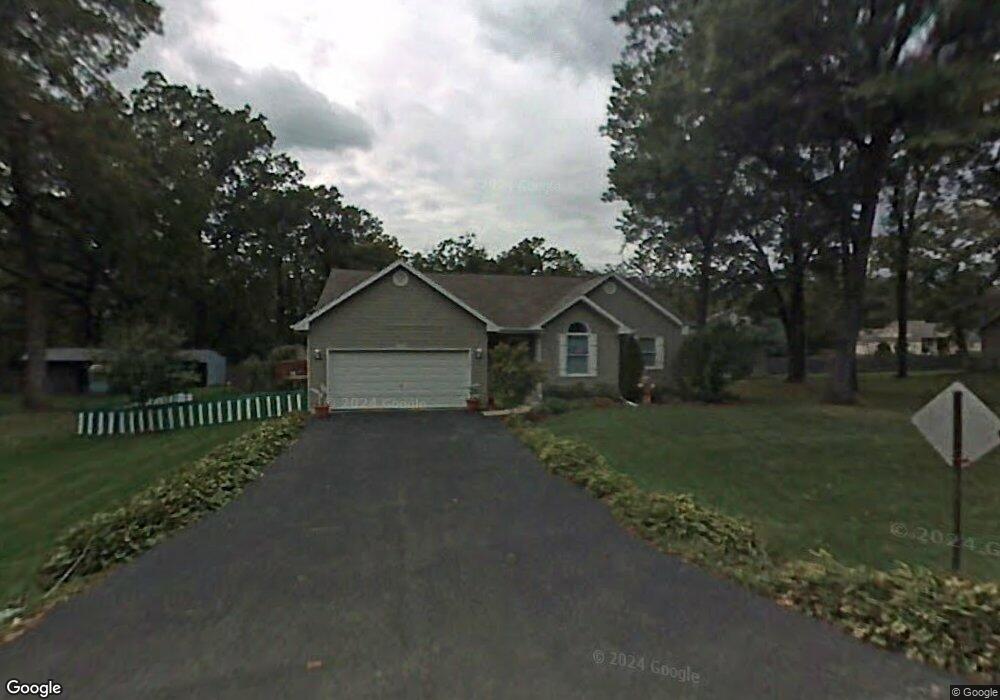
7917 Bellvue Ave Spring Grove, IL 60081
Estimated Value: $346,839 - $436,000
3
Beds
2
Baths
1,412
Sq Ft
$270/Sq Ft
Est. Value
About This Home
This home is located at 7917 Bellvue Ave, Spring Grove, IL 60081 and is currently estimated at $380,710, approximately $269 per square foot. 7917 Bellvue Ave is a home located in McHenry County with nearby schools including Spring Grove Elementary School, Nippersink Middle School, and Richmond-Burton High School.
Ownership History
Date
Name
Owned For
Owner Type
Purchase Details
Closed on
Oct 2, 2017
Sold by
Baglayan David and Baglayan Diane
Bought by
White James M and Whitewhite Roberta L
Current Estimated Value
Purchase Details
Closed on
Nov 30, 2005
Sold by
Baglayan Dolories
Bought by
Baglayan Dolories and Baglayan David
Purchase Details
Closed on
Sep 12, 2005
Sold by
Todd Candace J and Stade Candace J
Bought by
Baglayan Dolories
Purchase Details
Closed on
Jun 23, 1998
Sold by
J Moran Inc
Bought by
Todd Candace J
Home Financials for this Owner
Home Financials are based on the most recent Mortgage that was taken out on this home.
Original Mortgage
$113,400
Interest Rate
11.99%
Purchase Details
Closed on
Mar 25, 1998
Sold by
Super Mix Inc Profit Sharing Plan and Garrod Todd R
Bought by
J Moran Inc
Purchase Details
Closed on
Jul 7, 1997
Sold by
Lutzow Marian J
Bought by
Super Mix Inc
Create a Home Valuation Report for This Property
The Home Valuation Report is an in-depth analysis detailing your home's value as well as a comparison with similar homes in the area
Home Values in the Area
Average Home Value in this Area
Purchase History
| Date | Buyer | Sale Price | Title Company |
|---|---|---|---|
| White James M | $205,000 | Chicago Title | |
| Baglayan Dolories | -- | None Available | |
| Baglayan Dolories | $263,000 | Multiple | |
| Todd Candace J | $162,000 | -- | |
| J Moran Inc | $33,000 | Northern Land Title Corp | |
| Super Mix Inc | $120,000 | Chicago Title Insurance Co |
Source: Public Records
Mortgage History
| Date | Status | Borrower | Loan Amount |
|---|---|---|---|
| Previous Owner | Todd Candace J | $113,400 |
Source: Public Records
Tax History
| Year | Tax Paid | Tax Assessment Tax Assessment Total Assessment is a certain percentage of the fair market value that is determined by local assessors to be the total taxable value of land and additions on the property. | Land | Improvement |
|---|---|---|---|---|
| 2024 | $5,788 | $96,534 | $15,805 | $80,729 |
| 2023 | $5,699 | $90,034 | $14,741 | $75,293 |
| 2022 | $5,566 | $79,199 | $12,967 | $66,232 |
| 2021 | $5,256 | $74,660 | $12,224 | $62,436 |
| 2020 | $4,835 | $71,370 | $11,685 | $59,685 |
| 2019 | $4,953 | $70,260 | $11,503 | $58,757 |
| 2018 | $5,233 | $68,088 | $11,147 | $56,941 |
| 2017 | $5,124 | $63,939 | $10,468 | $53,471 |
| 2016 | $3,557 | $61,063 | $9,997 | $51,066 |
| 2013 | -- | $47,521 | $4,658 | $42,863 |
Source: Public Records
Map
Nearby Homes
- Lot 65,66,&64 Main Street Rd
- Lot 56 & 57 Beverly Way
- Lot 58 & 59 Beverly Way
- Lot 60 & 61 Beverly Way
- LOT 9 Mayo Ct
- 1410 Linden Rd
- 2214 Main Street Rd
- 1876 Red Oak Ln
- 1992 Red Oak Ln
- Lot 36 Red Oak Ln
- 1852 Red Oak Ln
- 1975 Red Oak Ln
- 1979 Red Oak Ln
- 1848 Red Oak Ln
- 1971 Red Oak Ln
- 7388 English Oak Ln
- 7393 English Oak Ln
- 7389 English Oak Ln
- 2003 Red Oak Ln
- 8501 Country Shire Ln
- 8005 Bellvue Ave
- 7907 Bellvue Ave
- 1511 Spring Ct
- 7920 Bellvue Ave
- 7950 Bellvue Ave
- 1604 Main Street Rd
- 1520 Main Street Rd
- 8006 Bellvue Ave
- 8007 Bellvue Ave
- 1512 Spring Ct
- 1514 Main Street Rd
- 1612 Main Street Rd
- 8008 Bellvue Ave
- 8009 Bellevue Ave
- 8009 Bellvue Ave
- 7919 Schmidt St
- Lot 65 & 66 Main Street Rd
- 0000 Lot Main St
- 1513 Main Street Rd
- 8010 Bellvue Ave
Your Personal Tour Guide
Ask me questions while you tour the home.