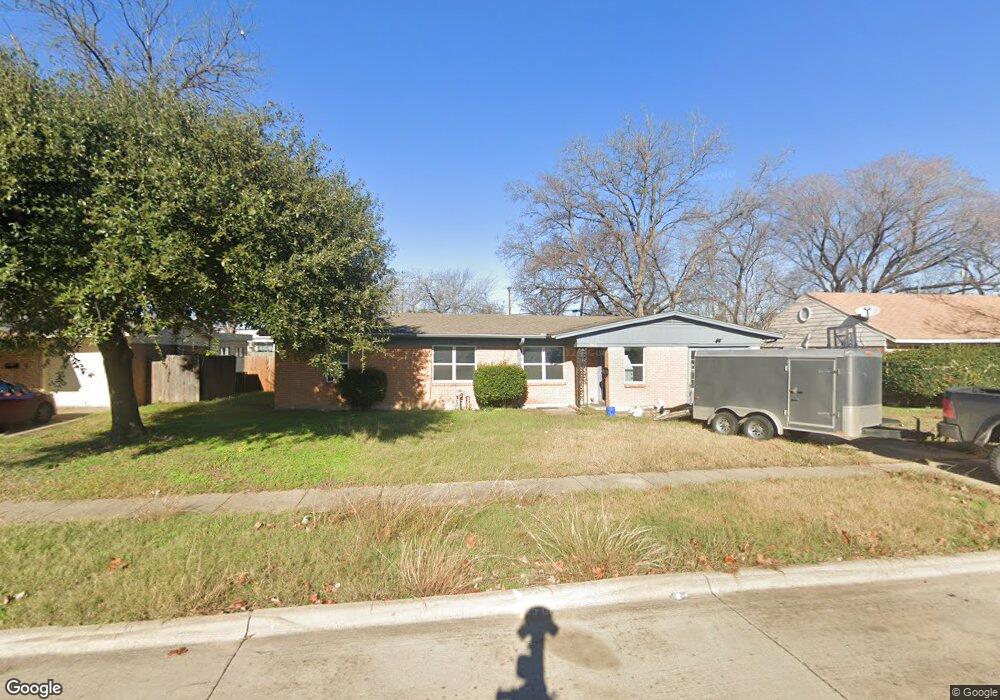
7917 Laura St North Richland Hills, TX 76180
Estimated Value: $245,000 - $304,000
3
Beds
2
Baths
1,493
Sq Ft
$178/Sq Ft
Est. Value
About This Home
This home is located at 7917 Laura St, North Richland Hills, TX 76180 and is currently estimated at $265,997, approximately $178 per square foot. 7917 Laura St is a home located in Tarrant County with nearby schools including Jack C Binion Elementary School, Richland Middle School, and Birdville High School.
Ownership History
Date
Name
Owned For
Owner Type
Purchase Details
Closed on
Jul 2, 2024
Sold by
Cowtown R/E Holdings Ltd
Bought by
Velasquez Florentino and Velasquez Daisy
Current Estimated Value
Purchase Details
Closed on
Dec 28, 2011
Sold by
Fannie Mae
Bought by
Cowtown R E Holdings Ltd
Home Financials for this Owner
Home Financials are based on the most recent Mortgage that was taken out on this home.
Original Mortgage
$37,600
Interest Rate
4.03%
Mortgage Type
Purchase Money Mortgage
Purchase Details
Closed on
Feb 18, 2004
Sold by
Helm Joe
Bought by
Sutton Mary F
Home Financials for this Owner
Home Financials are based on the most recent Mortgage that was taken out on this home.
Original Mortgage
$80,150
Interest Rate
5.67%
Mortgage Type
Purchase Money Mortgage
Create a Home Valuation Report for This Property
The Home Valuation Report is an in-depth analysis detailing your home's value as well as a comparison with similar homes in the area
Home Values in the Area
Average Home Value in this Area
Purchase History
| Date | Buyer | Sale Price | Title Company |
|---|---|---|---|
| Velasquez Florentino | -- | Old Republic National Title In | |
| Cowtown R E Holdings Ltd | -- | None Available | |
| Sutton Mary F | -- | Alamo Trin Western Title Co |
Source: Public Records
Mortgage History
| Date | Status | Borrower | Loan Amount |
|---|---|---|---|
| Previous Owner | Cowtown R E Holdings Ltd | $37,600 | |
| Previous Owner | Sutton Mary F | $80,150 |
Source: Public Records
Tax History Compared to Growth
Tax History
| Year | Tax Paid | Tax Assessment Tax Assessment Total Assessment is a certain percentage of the fair market value that is determined by local assessors to be the total taxable value of land and additions on the property. | Land | Improvement |
|---|---|---|---|---|
| 2025 | $4,297 | $198,009 | $55,000 | $143,009 |
| 2024 | $4,297 | $198,009 | $55,000 | $143,009 |
| 2023 | $3,249 | $217,734 | $55,000 | $162,734 |
| 2022 | $3,249 | $135,000 | $25,000 | $110,000 |
| 2021 | $3,435 | $135,000 | $25,000 | $110,000 |
| 2020 | $2,748 | $108,000 | $25,000 | $83,000 |
| 2019 | $2,844 | $108,000 | $25,000 | $83,000 |
| 2018 | $2,898 | $110,048 | $25,000 | $85,048 |
| 2017 | $3,013 | $112,000 | $25,000 | $87,000 |
| 2016 | $2,691 | $100,000 | $15,000 | $85,000 |
| 2015 | $1,263 | $47,000 | $12,000 | $35,000 |
| 2014 | $1,263 | $47,000 | $12,000 | $35,000 |
Source: Public Records
Map
Nearby Homes
- 7908 Lazy Lane Rd
- 8020 Laura St
- 5020 Colorado Blvd
- 5016 Wyoming Trail
- 5113 Bob Dr
- 4916 Susan Lee Ln
- 7717 Janetta Dr
- 5024 Maryanna Way
- 7800 Arnold Terrace
- 5304 Colorado Blvd
- Dalton II Plan at City Point
- Zoe Plan at City Point
- Hampton Plan at City Point
- Conrad Plan at City Point
- 4540 Ward St
- 5016 Winder Ct
- 5117 Maryanna Way
- 4357 Union St
- 4352 Henderson Ave
- 4529 Ward St