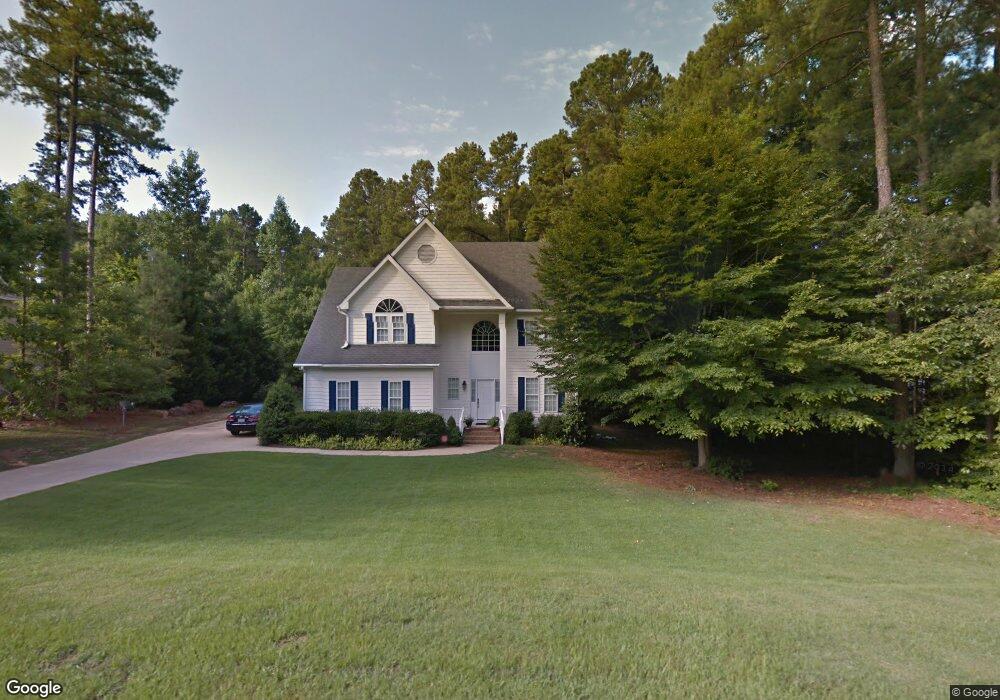
7917 Stone Forest Way Wake Forest, NC 27587
Falls Lake NeighborhoodEstimated Value: $578,000 - $652,355
4
Beds
3
Baths
2,514
Sq Ft
$245/Sq Ft
Est. Value
About This Home
This home is located at 7917 Stone Forest Way, Wake Forest, NC 27587 and is currently estimated at $614,839, approximately $244 per square foot. 7917 Stone Forest Way is a home located in Wake County with nearby schools including North Forest Pines Elementary School, Wakefield Middle, and Wakefield High School.
Ownership History
Date
Name
Owned For
Owner Type
Purchase Details
Closed on
May 19, 2020
Sold by
Jahr Troy A and Jahr Tonya L
Bought by
Hyndman Jason and Hyndman Megan
Current Estimated Value
Purchase Details
Closed on
Nov 20, 1998
Sold by
Jerry W Looper Construction Inc
Bought by
Jahr Troy A and Jahr Tonya L
Home Financials for this Owner
Home Financials are based on the most recent Mortgage that was taken out on this home.
Original Mortgage
$196,041
Interest Rate
6.95%
Purchase Details
Closed on
Jul 10, 1998
Sold by
Lk Properties
Bought by
Jerry W Looper Construction Inc
Home Financials for this Owner
Home Financials are based on the most recent Mortgage that was taken out on this home.
Original Mortgage
$178,400
Interest Rate
7.02%
Create a Home Valuation Report for This Property
The Home Valuation Report is an in-depth analysis detailing your home's value as well as a comparison with similar homes in the area
Home Values in the Area
Average Home Value in this Area
Purchase History
| Date | Buyer | Sale Price | Title Company |
|---|---|---|---|
| Hyndman Jason | $385,000 | None Available | |
| Jahr Troy A | $212,500 | -- | |
| Jerry W Looper Construction Inc | $42,000 | -- |
Source: Public Records
Mortgage History
| Date | Status | Borrower | Loan Amount |
|---|---|---|---|
| Previous Owner | Jahr Troy A | $196,041 | |
| Previous Owner | Jerry W Looper Construction Inc | $178,400 | |
| Closed | Jerry W Looper Construction Inc | $10,650 |
Source: Public Records
Tax History Compared to Growth
Tax History
| Year | Tax Paid | Tax Assessment Tax Assessment Total Assessment is a certain percentage of the fair market value that is determined by local assessors to be the total taxable value of land and additions on the property. | Land | Improvement |
|---|---|---|---|---|
| 2025 | $3,729 | $579,834 | $135,650 | $444,184 |
| 2024 | $3,621 | $579,834 | $135,650 | $444,184 |
| 2023 | $2,877 | $366,436 | $86,240 | $280,196 |
| 2022 | $2,666 | $366,436 | $86,240 | $280,196 |
| 2021 | $2,595 | $366,436 | $86,240 | $280,196 |
| 2020 | $2,552 | $366,436 | $86,240 | $280,196 |
| 2019 | $2,065 | $250,452 | $66,000 | $184,452 |
| 2018 | $1,899 | $250,452 | $66,000 | $184,452 |
| 2017 | $1,801 | $250,452 | $66,000 | $184,452 |
| 2016 | $1,764 | $250,452 | $66,000 | $184,452 |
| 2015 | $2,031 | $289,544 | $66,000 | $223,544 |
| 2014 | $1,925 | $289,544 | $66,000 | $223,544 |
Source: Public Records
Map
Nearby Homes
- 8128 Baronleigh Ln
- 1324 Sandybrook Ln
- 7616 Hasentree Way
- 1236 Perry Bluff Dr
- 8208 Mary Claire Ln
- 1416 Sandybrook Ln
- 1224 Perry Bluff Dr
- 8201 Mary Claire Ln
- 1220 Perry Bluff Dr
- 1117 Delilia Ln
- 1212 Perry Bluff Dr
- 8101 Fergus Ct
- 1112 Delilia Ln
- 1105 Delilia Ln
- 913 Harrison Ridge Rd
- 1013 Traders Trail
- 7312 Hasentree Way
- 8417 Wolverton Fields Dr
- 2005 Shingleback Dr
- 8017 Bud Morris Rd
- 7921 Stone Forest Way
- 7913 Stone Forest Way
- 8228 Baronleigh Ln
- 7925 Stone Forest Way
- 8236 Baronleigh Ln
- 7905 Stone Forest Way
- 7920 Stone Forest Way
- 7901 Stone Forest Way
- 7924 Stone Forest Way
- 7912 Stone Forest Way
- 7908 Stone Forest Way
- 7920 Stony Hill Rd
- 7928 Stone Forest Way
- 7916 Stone Forest Way
- 7917 Stony Hill Rd
- 7904 Stony Hill Rd
- 1404 The Pines Place
- 7924 Stony Hill Rd
- 7900 Stone Forest Way
- 8004 Stony Hill Rd