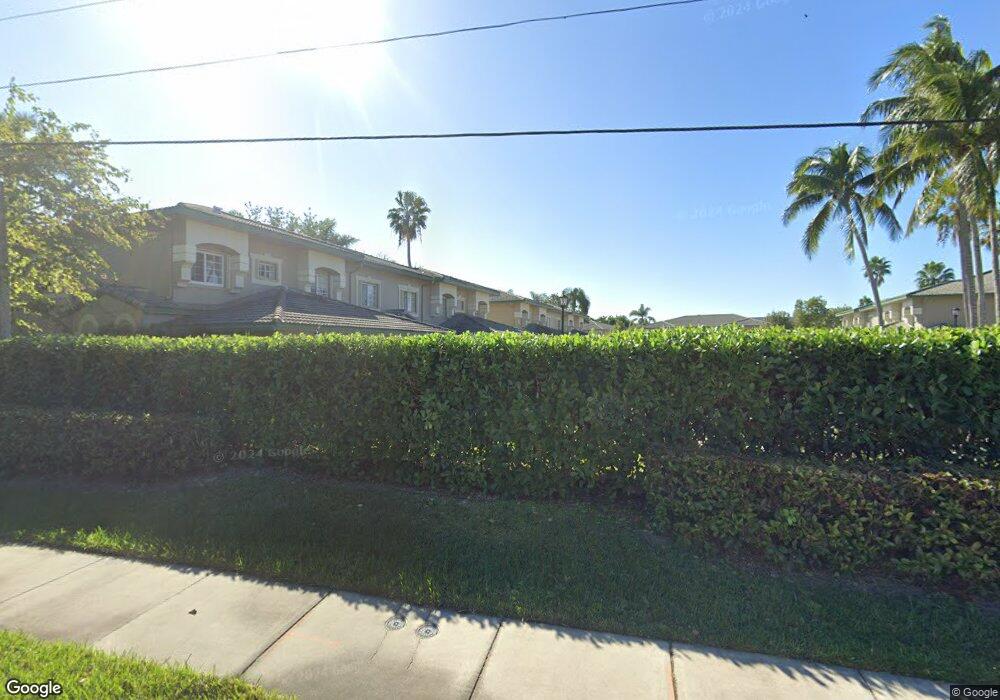
7918 Exeter Cir W Unit 102 Tamarac, FL 33321
Estimated Value: $287,000 - $427,000
3
Beds
2
Baths
1,692
Sq Ft
$207/Sq Ft
Est. Value
About This Home
This home is located at 7918 Exeter Cir W Unit 102, Tamarac, FL 33321 and is currently estimated at $349,591, approximately $206 per square foot. 7918 Exeter Cir W Unit 102 is a home located in Broward County with nearby schools including Challenger Elementary School, Millennium Middle School, and J. P. Taravella High School.
Ownership History
Date
Name
Owned For
Owner Type
Purchase Details
Closed on
Dec 6, 2019
Sold by
Raft Carole R
Bought by
Raft Carole R and Raft Jodi
Current Estimated Value
Purchase Details
Closed on
Sep 19, 2011
Sold by
Raft Carole R
Bought by
Raft Carole R and Raft Jodi
Purchase Details
Closed on
Mar 14, 2002
Sold by
Kaufmann Carol S
Bought by
Raft Carole R
Home Financials for this Owner
Home Financials are based on the most recent Mortgage that was taken out on this home.
Original Mortgage
$125,000
Interest Rate
5%
Purchase Details
Closed on
Jul 5, 2001
Sold by
Ruth Borok I
Bought by
Kaufmann Carol S
Purchase Details
Closed on
Oct 9, 1998
Sold by
Lennar Homes Inc
Bought by
Borok Ruth and Dillaman Audrey B
Home Financials for this Owner
Home Financials are based on the most recent Mortgage that was taken out on this home.
Original Mortgage
$60,000
Interest Rate
6.95%
Mortgage Type
New Conventional
Create a Home Valuation Report for This Property
The Home Valuation Report is an in-depth analysis detailing your home's value as well as a comparison with similar homes in the area
Home Values in the Area
Average Home Value in this Area
Purchase History
| Date | Buyer | Sale Price | Title Company |
|---|---|---|---|
| Raft Carole R | $47,000 | Attorney | |
| Raft Carole R | -- | Attorney | |
| Raft Carole R | $164,000 | -- | |
| Kaufmann Carol S | $160,000 | -- | |
| Borok Ruth | $120,000 | -- |
Source: Public Records
Mortgage History
| Date | Status | Borrower | Loan Amount |
|---|---|---|---|
| Previous Owner | Raft Carole R | $125,000 | |
| Previous Owner | Borok Ruth | $60,000 |
Source: Public Records
Tax History Compared to Growth
Tax History
| Year | Tax Paid | Tax Assessment Tax Assessment Total Assessment is a certain percentage of the fair market value that is determined by local assessors to be the total taxable value of land and additions on the property. | Land | Improvement |
|---|---|---|---|---|
| 2025 | $3,298 | $172,160 | -- | -- |
| 2024 | $3,219 | $167,310 | -- | -- |
| 2023 | $3,219 | $162,440 | $0 | $0 |
| 2022 | $3,096 | $157,710 | $0 | $0 |
| 2021 | $3,018 | $153,120 | $0 | $0 |
| 2020 | $2,971 | $151,010 | $0 | $0 |
| 2019 | $3,020 | $147,620 | $0 | $0 |
| 2018 | $2,923 | $144,870 | $0 | $0 |
| 2017 | $2,883 | $141,900 | $0 | $0 |
| 2016 | $2,876 | $138,990 | $0 | $0 |
| 2015 | $2,825 | $138,030 | $0 | $0 |
| 2014 | $2,831 | $136,940 | $0 | $0 |
| 2013 | -- | $142,280 | $14,230 | $128,050 |
Source: Public Records
Map
Nearby Homes
- 10300 NW 80th Ct
- 7840 Trent Dr Unit 111
- 7731 Granville Dr Unit 204
- 7940 Exeter Cir E Unit 201
- 7856 Dixie Beach Cir
- 7776 Trent Dr Unit 305
- 7788 Trent Dr Unit 311
- 7802 Trent Dr Unit 406
- 7740 Granville Dr Unit 207
- 7952 Exeter Cir E Unit 201
- 7730 Granville Dr Unit 202
- 7760 Granville Dr Unit 303
- 8010 NW 103rd Ave
- 8216 Santa Monica Ave
- 7919 Exeter Blvd E Unit 102
- 7680 Trent Dr Unit 310
- 7702 Trent Dr Unit 408
- 7676 Trent Dr Unit 308
- 7678 Trent Dr Unit 309
- 7635 Granville Dr Unit 206
- 7902 Exeter Blvd W Unit 201
- 7922 Exeter Cir W Unit 202
- 7920 Exeter Cir W Unit 201
- 7910 Exeter Cir W Unit 201
- 7906 Exeter Cir W Unit 101
- 7908 Exeter Cir W Unit 102
- 7948 Exeter Cir W Unit 202
- 7948 Exeter Cir W Unit 202
- 7991 Exeter Blvd E Unit 102
- 7989 Exeter Blvd E Unit 101
- 7944 Exeter Cir W Unit 102
- 7995 Exeter Blvd E Unit 103
- 7995 Exeter Blvd E
- 7993 Exeter Blvd E Unit 202
- 7934 Exeter Cir W Unit 201
- 7946 Exeter Cir W Unit 201
- 7987 Exeter Blvd E
- 7942 Exeter Cir W Unit 101