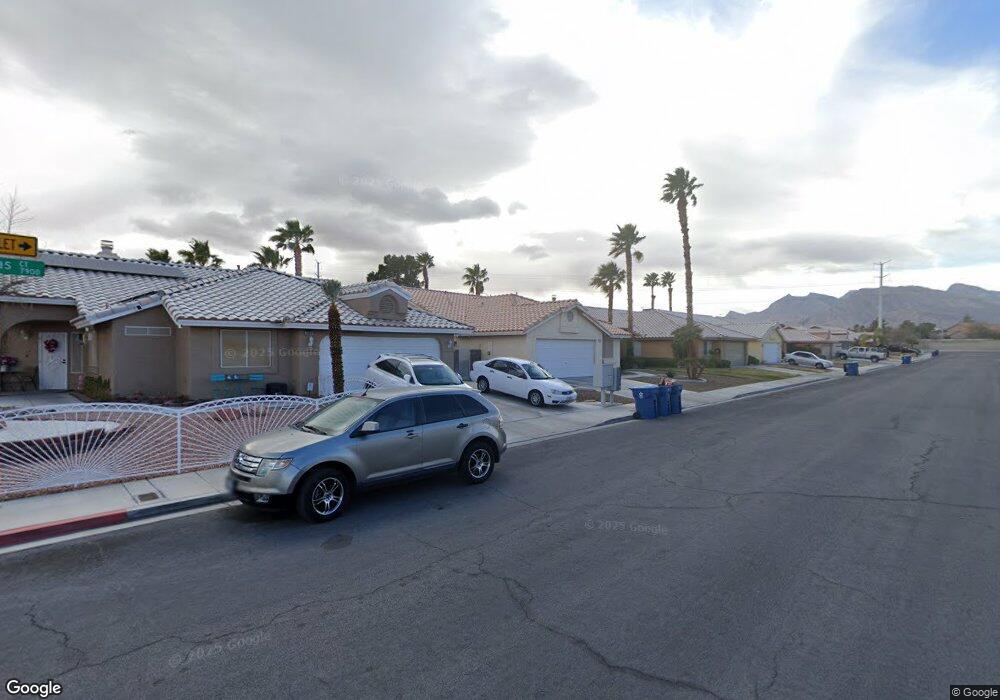
7919 Gorgas Ct Las Vegas, NV 89129
Lone Mountain NeighborhoodEstimated Value: $495,421 - $585,000
4
Beds
3
Baths
1,996
Sq Ft
$265/Sq Ft
Est. Value
About This Home
This home is located at 7919 Gorgas Ct, Las Vegas, NV 89129 and is currently estimated at $528,855, approximately $264 per square foot. 7919 Gorgas Ct is a home located in Clark County with nearby schools including Marc Kahre Elementary School, Dorothy Eisenberg Elementary School, and Irwin & Susan Molasky Junior High School.
Ownership History
Date
Name
Owned For
Owner Type
Purchase Details
Closed on
Apr 22, 2019
Sold by
Marion Lewis A and Marion Fmtr E F
Bought by
Davis Jennifer and Marion Danielle
Current Estimated Value
Purchase Details
Closed on
Mar 15, 2001
Sold by
Betti Thomas R and Betti Paula K
Bought by
Marion Lewis A and Marion Doris E
Home Financials for this Owner
Home Financials are based on the most recent Mortgage that was taken out on this home.
Original Mortgage
$108,000
Interest Rate
7.15%
Purchase Details
Closed on
Feb 15, 2001
Sold by
Marion Lewis A and Marion Doris E
Bought by
Marion Lewis A and Marion Doris E
Home Financials for this Owner
Home Financials are based on the most recent Mortgage that was taken out on this home.
Original Mortgage
$108,000
Interest Rate
7.15%
Purchase Details
Closed on
Jan 25, 1995
Sold by
Rhodes Design & Development Corp
Bought by
Betti Thomas R and Betti Paula K
Home Financials for this Owner
Home Financials are based on the most recent Mortgage that was taken out on this home.
Original Mortgage
$132,300
Interest Rate
5.75%
Create a Home Valuation Report for This Property
The Home Valuation Report is an in-depth analysis detailing your home's value as well as a comparison with similar homes in the area
Home Values in the Area
Average Home Value in this Area
Purchase History
| Date | Buyer | Sale Price | Title Company |
|---|---|---|---|
| Davis Jennifer | -- | None Available | |
| Marion Lewis A | $190,000 | Old Republic Title Company | |
| Marion Lewis A | -- | -- | |
| Betti Thomas R | $147,500 | United Title |
Source: Public Records
Mortgage History
| Date | Status | Borrower | Loan Amount |
|---|---|---|---|
| Previous Owner | Marion Lewis A | $108,000 | |
| Previous Owner | Betti Thomas R | $132,300 |
Source: Public Records
Tax History Compared to Growth
Tax History
| Year | Tax Paid | Tax Assessment Tax Assessment Total Assessment is a certain percentage of the fair market value that is determined by local assessors to be the total taxable value of land and additions on the property. | Land | Improvement |
|---|---|---|---|---|
| 2025 | $2,099 | $107,353 | $39,900 | $67,453 |
| 2024 | $2,039 | $107,353 | $39,900 | $67,453 |
| 2023 | $2,039 | $100,039 | $35,700 | $64,339 |
| 2022 | $1,979 | $97,522 | $38,500 | $59,022 |
| 2021 | $1,922 | $87,190 | $30,800 | $56,390 |
| 2020 | $1,863 | $87,564 | $31,500 | $56,064 |
| 2019 | $1,840 | $76,959 | $21,700 | $55,259 |
| 2018 | $1,756 | $73,596 | $20,300 | $53,296 |
| 2017 | $2,439 | $74,394 | $20,300 | $54,094 |
| 2016 | $1,644 | $67,656 | $13,300 | $54,356 |
| 2015 | $1,640 | $61,741 | $11,200 | $50,541 |
| 2014 | $1,593 | $47,133 | $8,750 | $38,383 |
Source: Public Records
Map
Nearby Homes
- 3685 Julius Ct
- 3695 Funston Way
- 3758 Norton Dr
- 3632 Julia Waldene Ct
- 3600 N Tomsik St
- 3473 Conough Ln Unit 5
- 3645 Julia Waldene Ct
- 8036 Hurricane Cove Ct
- 8212 Cactus Root Ct
- 8233 Rocky Bluff Way
- 7633 Winterthur Ct
- 3352 Moon River St Unit 1
- 3560 Unique Way
- 7836 Morning Flower Ln
- 3508 Tuscany Village Dr
- 3553 Unique Way
- 7908 Constantinople Ave
- 8200 Amersham Ave
- 7900 Constantinople Ave
- 3546 Reserve Ct
- 7929 Gorgas Ct
- 7909 Gorgas Ct
- 7939 Gorgas Ct
- 7920 Gorgas Ct
- 7949 Gorgas Ct
- 7910 Gorgas Ct
- 7930 Gorgas Ct
- 3604 N Valadez St
- 7940 Gorgas Ct
- 3624 N Valadez St
- 7959 Gorgas Ct
- 7950 Gorgas Ct
- 3644 N Valadez St
- 3625 N Valadez St
- 3652 Julius Ct
- 7960 Gorgas Ct Unit none
- 7960 Gorgas Ct
- 7979 Gorgas Ct
- 7970 Gorgas Ct
- 3633 N Valadez St