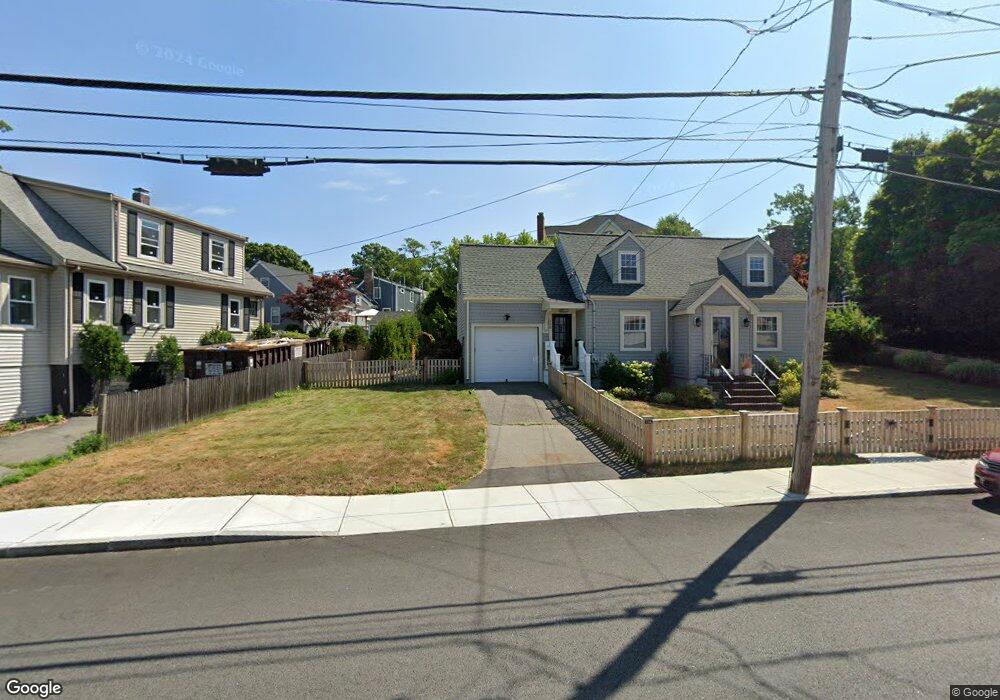
792 E Squantum St Quincy, MA 02171
Squantum NeighborhoodEstimated Value: $816,568 - $905,000
3
Beds
2
Baths
1,268
Sq Ft
$674/Sq Ft
Est. Value
About This Home
This home is located at 792 E Squantum St, Quincy, MA 02171 and is currently estimated at $854,642, approximately $674 per square foot. 792 E Squantum St is a home located in Norfolk County with nearby schools including Squantum Elementary School, Atlantic Middle School, and North Quincy High School.
Ownership History
Date
Name
Owned For
Owner Type
Purchase Details
Closed on
Nov 15, 2017
Sold by
Ahern Erin J
Bought by
Ahern Ryan E and Ahern Erin J
Current Estimated Value
Purchase Details
Closed on
Jun 21, 2013
Sold by
Foy Seamus and Foy Giuliana
Bought by
Johnson Erin
Purchase Details
Closed on
Jun 6, 2008
Sold by
Hayes Peter A and Hayes Anne M
Bought by
Foy Seamus and Foy Giuliana
Home Financials for this Owner
Home Financials are based on the most recent Mortgage that was taken out on this home.
Original Mortgage
$380,036
Interest Rate
6.11%
Mortgage Type
Purchase Money Mortgage
Purchase Details
Closed on
May 25, 1995
Sold by
Indelicato Joseph R
Bought by
Hayes Peter A and Hayes Anne M
Purchase Details
Closed on
Oct 1, 1993
Sold by
Kearns Nancy
Bought by
Indelicato Joseph R
Home Financials for this Owner
Home Financials are based on the most recent Mortgage that was taken out on this home.
Original Mortgage
$127,500
Interest Rate
7%
Mortgage Type
Purchase Money Mortgage
Create a Home Valuation Report for This Property
The Home Valuation Report is an in-depth analysis detailing your home's value as well as a comparison with similar homes in the area
Home Values in the Area
Average Home Value in this Area
Purchase History
| Date | Buyer | Sale Price | Title Company |
|---|---|---|---|
| Ahern Ryan E | -- | -- | |
| Ahern Ryan E | -- | -- | |
| Johnson Erin | $369,000 | -- | |
| Foy Seamus | $386,000 | -- | |
| Hayes Peter A | $159,950 | -- | |
| Indelicato Joseph R | $149,000 | -- |
Source: Public Records
Mortgage History
| Date | Status | Borrower | Loan Amount |
|---|---|---|---|
| Previous Owner | Indelicato Joseph R | $380,625 | |
| Previous Owner | Foy Seamus | $380,036 | |
| Previous Owner | Indelicato Joseph R | $127,500 | |
| Closed | Johnson Erin | $0 |
Source: Public Records
Tax History
| Year | Tax Paid | Tax Assessment Tax Assessment Total Assessment is a certain percentage of the fair market value that is determined by local assessors to be the total taxable value of land and additions on the property. | Land | Improvement |
|---|---|---|---|---|
| 2025 | $8,592 | $745,200 | $428,300 | $316,900 |
| 2024 | $8,121 | $720,600 | $407,900 | $312,700 |
| 2023 | $7,574 | $680,500 | $388,400 | $292,100 |
| 2022 | $7,674 | $640,600 | $323,700 | $316,900 |
| 2021 | $6,794 | $559,600 | $323,700 | $235,900 |
| 2020 | $6,436 | $517,800 | $294,300 | $223,500 |
| 2019 | $6,162 | $491,000 | $294,300 | $196,700 |
| 2018 | $6,286 | $471,200 | $280,200 | $191,000 |
| 2017 | $5,597 | $395,000 | $243,700 | $151,300 |
| 2016 | $5,213 | $363,000 | $221,500 | $141,500 |
| 2015 | $5,130 | $351,400 | $221,500 | $129,900 |
| 2014 | $4,849 | $326,300 | $221,500 | $104,800 |
Source: Public Records
Map
Nearby Homes
- 1 Parke Ave
- 865 E Squantum St
- 130 Parke Ave (Lot 2)
- 156 Parke Ave
- 11 Bellevue Rd
- 19 Harbourside Rd Unit 19
- 21 Harbourside Rd Unit 26
- 100 Marina Dr Unit 615
- 100 Marina Dr Unit 306
- 1001 Marina Dr Unit 705
- 1001 Marina Dr Unit 708
- 1001 Marina Dr Unit 213
- 2001 Marina Dr Unit 506W
- 2001 Marina Dr Unit 211
- 10 Seaport Dr Unit 2213
- 297 Billings St
- 212 Quincy Shore Dr
- 175 Quincy Shore Dr Unit B24
- 175 Quincy Shore Dr Unit B23
- 201 Billings St
- 790 E Squantum St
- 782 E Squantum St
- 8 Landgrane St
- 802 E Squantum St
- 19 Huckins Ave
- 797 E Squantum St Unit 3
- 14 Landgrane St
- 9 Landgrane St
- 23 Huckins Ave
- 2 Huckins Ave
- 810 E Squantum St
- 805 E Squantum St
- 10 Huckins Ave
- 4 Huckins Ave
- 14 Huckins Ave
- 811 E Squantum St Unit 1
- 811 E Squantum St Unit 5
- 99 Mayflower Rd
- 17 Landgrane St
- 18 Huckins Ave
Your Personal Tour Guide
Ask me questions while you tour the home.