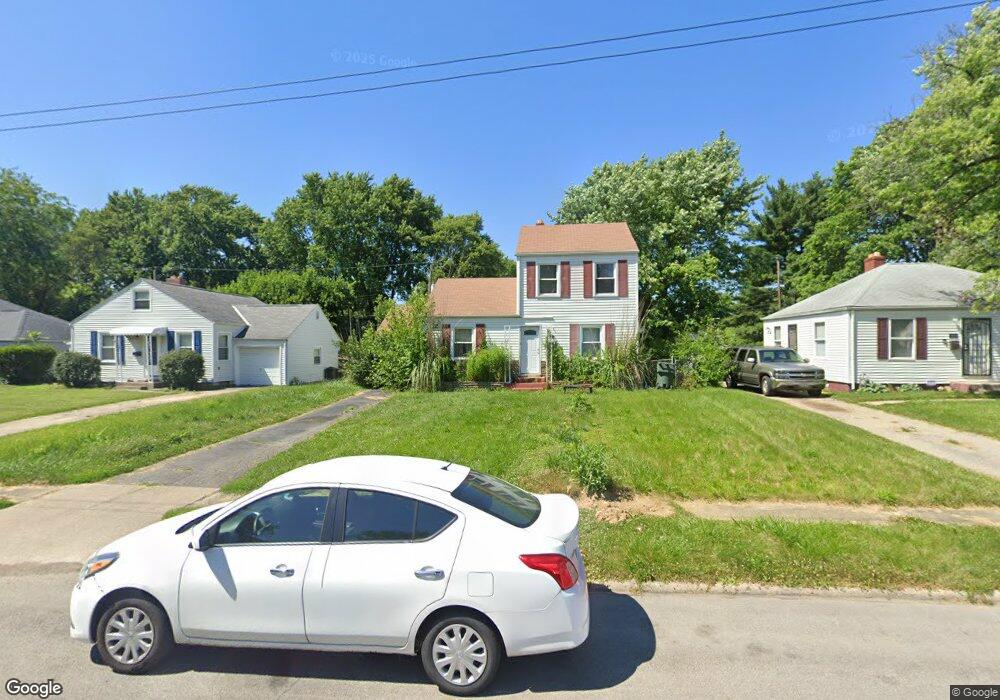
792 E Tulane Rd Columbus, OH 43211
North Linden NeighborhoodEstimated Value: $148,000 - $191,000
4
Beds
1
Bath
1,104
Sq Ft
$149/Sq Ft
Est. Value
About This Home
This home is located at 792 E Tulane Rd, Columbus, OH 43211 and is currently estimated at $164,630, approximately $149 per square foot. 792 E Tulane Rd is a home located in Franklin County with nearby schools including Como Elementary School, Dominion Middle School, and Whetstone High School.
Ownership History
Date
Name
Owned For
Owner Type
Purchase Details
Closed on
Aug 9, 2023
Sold by
Brown Christopher G
Bought by
23Rd Street Holdings Llc
Current Estimated Value
Purchase Details
Closed on
Jun 26, 2001
Sold by
Smith Sheila D and Smith Sheila D
Bought by
Brown Christopher G
Home Financials for this Owner
Home Financials are based on the most recent Mortgage that was taken out on this home.
Original Mortgage
$74,805
Interest Rate
7.27%
Mortgage Type
FHA
Purchase Details
Closed on
Jun 5, 1995
Sold by
Woods Charles
Bought by
Schofield Keith and Schofield Samira
Home Financials for this Owner
Home Financials are based on the most recent Mortgage that was taken out on this home.
Original Mortgage
$62,500
Interest Rate
8.26%
Mortgage Type
New Conventional
Create a Home Valuation Report for This Property
The Home Valuation Report is an in-depth analysis detailing your home's value as well as a comparison with similar homes in the area
Home Values in the Area
Average Home Value in this Area
Purchase History
| Date | Buyer | Sale Price | Title Company |
|---|---|---|---|
| 23Rd Street Holdings Llc | -- | None Listed On Document | |
| Brown Christopher G | $76,000 | Lawyers Title | |
| Schofield Keith | $65,800 | -- |
Source: Public Records
Mortgage History
| Date | Status | Borrower | Loan Amount |
|---|---|---|---|
| Previous Owner | Brown Christopher G | $74,805 | |
| Previous Owner | Schofield Keith | $62,500 |
Source: Public Records
Tax History
| Year | Tax Paid | Tax Assessment Tax Assessment Total Assessment is a certain percentage of the fair market value that is determined by local assessors to be the total taxable value of land and additions on the property. | Land | Improvement |
|---|---|---|---|---|
| 2025 | $2,651 | $54,570 | $10,780 | $43,790 |
| 2024 | $2,651 | $54,570 | $10,780 | $43,790 |
| 2023 | $2,470 | $54,570 | $10,780 | $43,790 |
| 2022 | $1,633 | $27,900 | $7,530 | $20,370 |
| 2021 | $1,635 | $27,900 | $7,530 | $20,370 |
| 2020 | $1,638 | $27,900 | $7,530 | $20,370 |
| 2019 | $1,617 | $23,600 | $6,550 | $17,050 |
| 2018 | $1,375 | $23,600 | $6,550 | $17,050 |
| 2017 | $1,379 | $23,600 | $6,550 | $17,050 |
| 2016 | $1,242 | $17,540 | $3,710 | $13,830 |
| 2015 | $1,135 | $17,540 | $3,710 | $13,830 |
| 2014 | $1,088 | $17,540 | $3,710 | $13,830 |
| 2013 | $682 | $20,650 | $4,375 | $16,275 |
Source: Public Records
Map
Nearby Homes
- 2733 Beulah Rd
- 2593 Osceola Ave
- 3035 Audubon Rd
- 580 Crestview Rd
- 759 E Longview Ave
- 2569 Audubon Rd
- 2560 Osceola Ave
- 2776 Howey Rd
- 2593 Atwood Terrace
- 914 Weldon Ave
- 555 E Weber Rd
- 2888 Howey Rd
- 2582 Atwood Terrace
- 2897 Grasmere Ave
- 2874 Grasmere Ave
- 2595 Grasmere Ave
- 2950 Grasmere Ave
- 2459 Atwood Terrace
- 2836-2838 Indianola Ave Unit 2836
- 1166 Minnesota Ave
- 786 E Tulane Rd
- 800 E Tulane Rd
- 780 E Tulane Rd
- 797 E Tibet Rd
- 791 E Tibet Rd
- 807 E Tibet Rd
- 774 E Tulane Rd
- 785 E Tibet Rd
- 791 E Tulane Rd
- 783 E Tulane Rd
- 797 E Tulane Rd
- 2818 Audubon Rd
- 777 E Tulane Rd
- 2824 Audubon Rd
- 766 E Tulane Rd
- 2812 Audubon Rd
- 2832 Audubon Rd
- 2804 Audubon Rd
- 771 E Tulane Rd
- 2838 Audubon Rd
Your Personal Tour Guide
Ask me questions while you tour the home.